
Mobile App Industry Statistics By Millennial Preferences, Smart Phone Users, Country, User Retention, Age Group, Spending Over Time
Page Contents
- Introduction
- Editor’s Choice
- Facts About Mobile App Industry
- General Statistics
- Global Mobile App Market Statistics
- by Most Frequently Used
- by Desktop vs. Mobile
- by Millennial Preferences
- by Age Groups
- by App Store Spending Over Time
- App Checking Statistics by Smartphone Users
- Mobile Apps Download Statistics by Country
- Average Monthly Hours on Mobile Apps Statistics by Age Group
- by User Retention
- Retention Rate Statistics by Type of Apps
- Popular Apps Statistics in the United States
- Popular Apps Statistics in the World
- Popular category apps Statistics on the Apple App Store and Google Play Store
- Mobile App Industry Statistics at a Glance
- Category Mobile App Industry Statistics Engagement Hours and Downloads
- Distribution Statistics by Free and Paid Apps
- Mobile Apps Importance Statistics for Businesses
- Conclusion
Introduction
Mobile App Industry Statistics: The reports say that the Mobile App industry has reached $206.85 billion by the end of 2022 and the annual growth rate will compound by 13.8% of CAGR starting from 2023 to 2030. Increased internet usage is the primary factor that enhanced remarkable market growth in many developing nations such as India, China, and India. The usage of mobile apps has increased in the last few years as almost everyone over the world is now using mobile applications for many works such as social networking, playing games, ordering food, and many more. These Mobile App Industry Statistics include various insights from different aspects that will provide light on the platform of mobile apps.
Editor’s Choice
- As of 2023, the market size of the mobile application market is going to be $228.98 billion.
- By the end of 2030, revenue generated by the mobile app industry will be $567.19 billion.
- In 2022 the market share of the Apple store segment including iOS apps has accounted for 62% of the global share.
- Whereas the highest downloads were experienced by the Google Play store segment across the world’s mobile app industry.
- In both segments of the mobile industry, Google Play Store and Apple App Store had 5.7 million apps and alone Apple Store had 2.2 million apps by the end of 2022.
- American people have downloaded around 80 apps on average on their smartphones and use around 10 apps per day.
- In 2022, people all over the world spent around 85% of their time on different apps.
- The Total number of downloaded apps in 2022 was 255 billion.
- Revenue from free apps on the Google Play store has earned around 98% of revenue.
Facts About Mobile App Industry
- In 2022, 38% of smartphone users downloaded apps for making transactions, and the rest 62% simply uninstalled the apps after their needs were fulfilled.
- As of 2023, revenue generated by the mobile apps will reach $201 billion a growth of 19.5% of CAGR from last year.
- By the end of 2025, mobile app spending of people is expected to cross more than $270 billion.
- The most downloaded app was TikTok with over downloaded over 104 million in February 2022.
- Across the world, people by 62% have installed gaming apps, and 66.5% of people installed map apps on their phones by the end of 2022.
- In the Google Play store, the download percentage of free apps was 95.4% and paid apps was 4.6% by the end of 2022.
- 70% of the U.S. people used digital media consumption accounted on mobile apps
 (Source: WORKFALL)
General Statistics
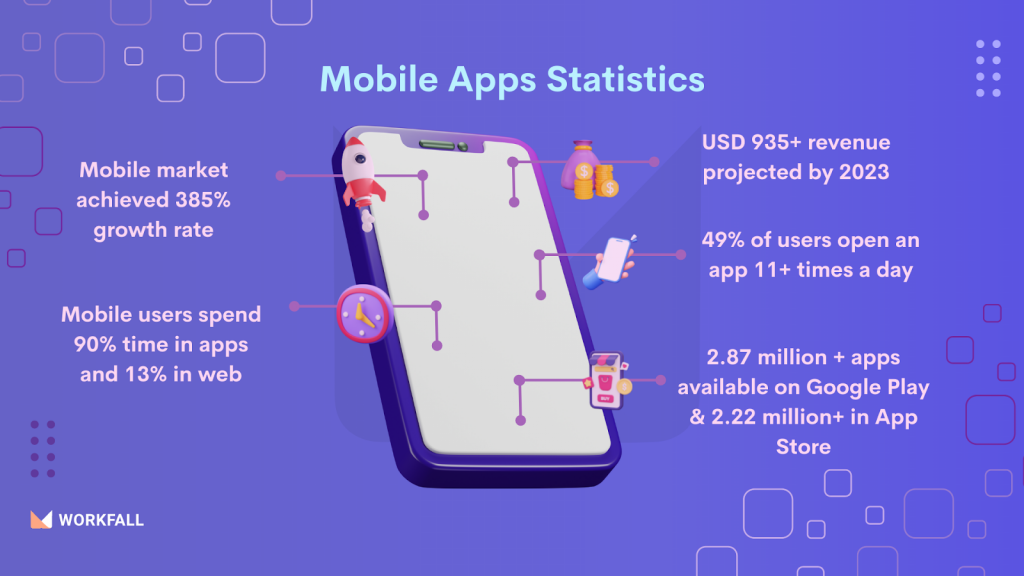
- In 2022, on average people used 30 apps in a month, and interestingly this is termed as a rule of 30:10 i.e., 30 apps in a month, 10 per day.
- In 2022, people all over the world spent around 85% of their time on different apps.
- The most used app by mobile phone was Facebook which has been downloaded by 98.5%
- As of 2023, revenue earned by mobile apps is expected to be $935 billion.
- Total hours spent on mobile is expected to reach 6 trillion by the end of 2028.
- By the end of 2022, the total downloaded apps on Android was 2.7 million and iOS was 1.85 million.
- As of 2022, spending on apps by global consumers has reached $129 billion iOS app earned $86.80 billion in revenue and the Google Play App earned $42.3 billion in revenue.
- By the 3rd quarter of 2022, in Apple App Store the number of apps downloads has dropped by 1.6 million.
- By the end of 2022, the smartphone penetration rate was highest by 59.9% and users turned out to 865.04 million.
- Smartphone users on average have installed 40 apps on their devices and 895 users spent their maximum time on 18 apps.
- Most apps time spent by young adults on an average of 112 hours/month and above 65 years old use an average of 51 hours/month
Global Mobile App Market Statistics
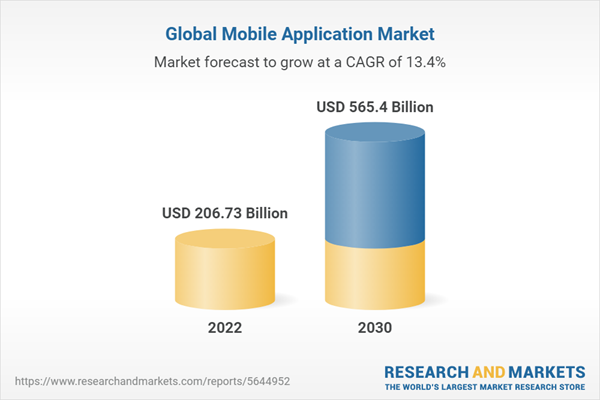
(Source: researchandmarkets.com)
- The global market size of the mobile app industry has grown by $206.73 billion by the end of 2022.
- The mobile app industry is expected to reach 13.4% of CAGR which is going to reach $565.4 billion by the end of 2030.
by Most Frequently Used
Sure, here are those statistics presented in a more descriptive and easy-to-understand format:
App Usage in 2022:
- Social Media Apps: These are apps like Facebook, Instagram, and Twitter, and 39% of people use them.
- Gaming Apps: Games like Candy Crush and Among Us are in this category, and 10% of people play them.
- Messaging Apps: Apps for sending messages, like WhatsApp and Snapchat, are used by 10% of people.
- Retail Apps: These are shopping apps like Amazon and eBay, and 7% of people use them.
Apple App Store Usage in 2022:
- Games: Games are the most popular category in the Apple App Store, with 21.07% of users downloading them.
- Business: Apps for work-related tasks like email and productivity tools make up 10.7% of downloads.
- Utilities: Utility apps, which include things like flashlight and calculator apps, account for 6.39% of downloads.
- Lifestyle: Apps related to daily life, such as fitness or travel apps, are downloaded by 8.58% of users.
- Education: Educational apps for learning and studying are downloaded by 8.66% of users.
by Desktop vs. Mobile
- In 2022, across the world, 98.5% of users have downloaded Facebook by any mobile phone.
- 81.8% downloaded and accessed only the app by mobile phones.
- 16.7% downloaded the app by both computer and phone.
- 1.5% of users have downloaded the app by Laptop or desktop.
by Millennial Preferences
- Amazon: This app is the most important one for millennials, with a whopping 35% of them using it regularly. It's where they shop for all sorts of things.
- Gmail: Gmail is the second most essential app, used by 30% of millennials. It's where they send and receive emails.
- Facebook Messenger: With 29% of millennials using it, Facebook Messenger is the go-to app for chatting and staying in touch with friends.
- YouTube: This app is pretty popular too, with 18% of millennials using it. They watch videos, listen to music, and learn from it.
- Google Maps: For getting around and finding places, 16% of millennials rely on Google Maps. It helps them navigate and find directions.
by Age Groups
- 11 – 20 years:
- Apps Used: Among young people aged 11 to 20, 32% of them use mobile apps regularly.
- Apps Installed: They have quite a few apps installed, with 45% of them having various apps on their devices.
- 21 – 30 years:
- Apps Used: For those in the 21 to 30 age range, 25% use mobile apps as part of their daily routine.
- Apps Installed: They tend to have a lot of apps installed, with 65% of them having numerous apps on their devices.
- 31 – 40 years:
- Apps Used: In the 31 to 40 age group, 17% of people use mobile apps regularly.
- Apps Installed: They have some apps installed, with 38% of them having a moderate number of apps on their devices.
- 41 – 50 years:
- Apps Used: Among individuals aged 41 to 50, 16% of them use mobile apps as part of their daily routine.
- Apps Installed: They tend to have fewer apps installed, with 24% of them having a limited number of apps on their devices.
- 51 – 60 years:
- Apps Used: In the 51 to 60 age group, 8% of people use mobile apps regularly.
- Apps Installed: They also have a limited number of apps installed, with 22% of them having a smaller selection of apps on their devices.
by App Store Spending Over Time
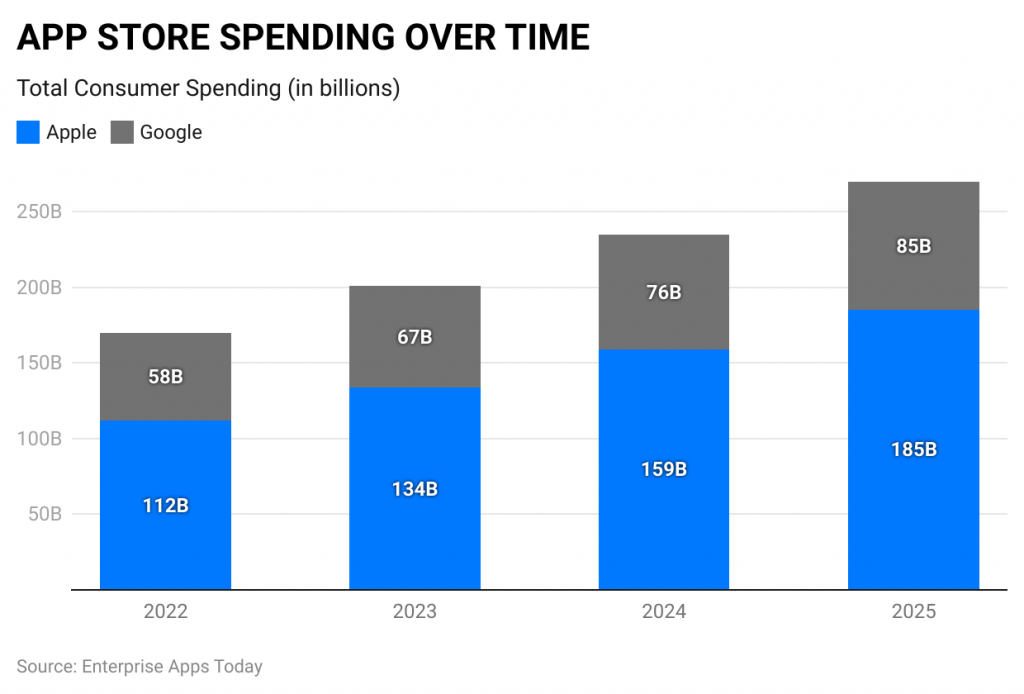 (Source: zippia.com)
2022:
- Apple App Store: Consumers spent a total of $112 billion.
- Google Play Store: Consumers spent a total of $58 billion.
2023:
- Apple App Store: Consumer spending increased to $134 billion.
- Google Play Store: Consumer spending rose to $67 billion.
2024*:
- Apple App Store: It saw further growth, reaching $159 billion in consumer spending.
- Google Play Store: Consumer spending on this platform reached $76 billion.
2025*:
- Apple App Store: It continued to expand, reaching a total of $185 billion in consumer spending.
- Google Play Store: Consumer spending on Google Play increased to $85 billion.
App Checking Statistics by Smartphone Users
- 51% of smartphone users check their apps between 1 to 10 times per day.
- 25% of smartphone users check their apps between 11 to 20 times per day.
- 16% of smartphone users check their apps between 21 to 50 times per day.
- 7% of smartphone users check their apps more than 50 times per day.
Mobile Apps Download Statistics by Country
 (Source: statista.com)
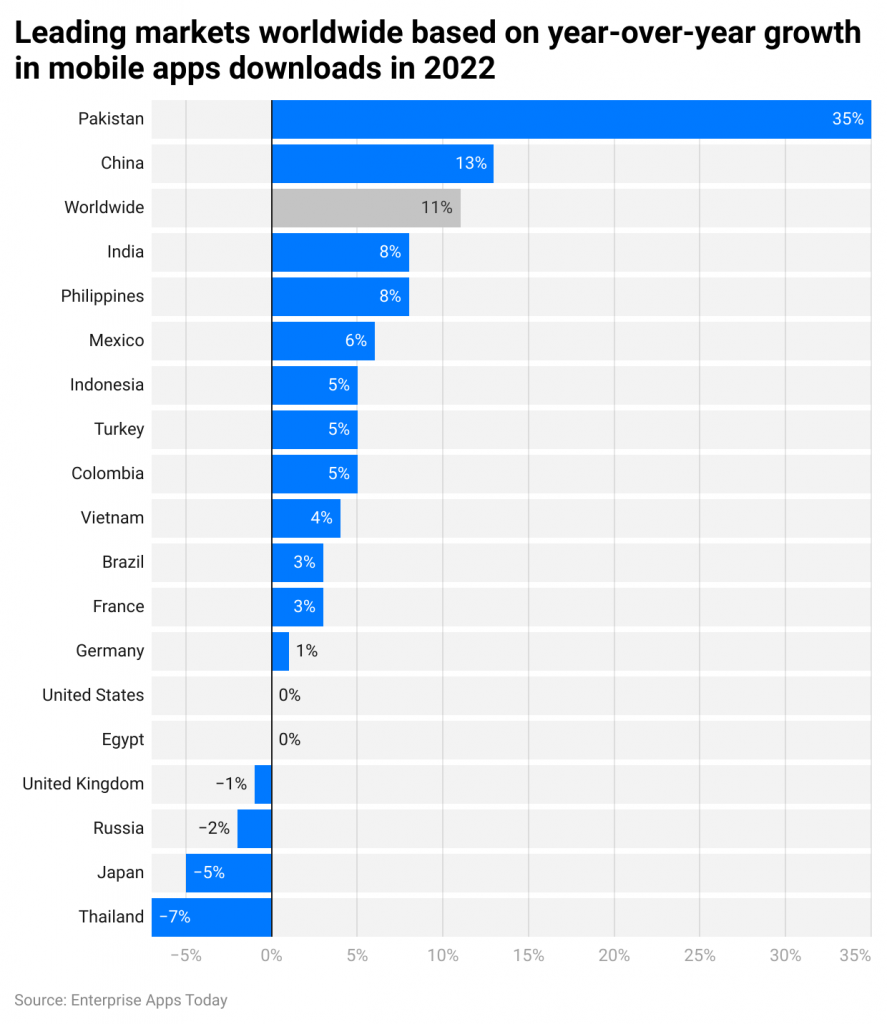
- As of 2022, the leading market of mobile apps downloaded worldwide was Pakistan which increased by 35% followed by China (+13%), and India (+8%) from last year.
- Philippines and Mexico the rate of mobile apps downloaded has increased by 8% and 6% respectively.
- Indonesia = 5%, Turkey = 5%, Colombia = 5%, Vietnam = 4%, Brazil = 3%, France = 3%, Germany = 15.
- Only the rate of apps downloaded in the United States and Egypt remained constant in 2022 as of last year.
- In the United Kingdom, Russia, Japan, and Thailand the mobile apps downloaded have decreased by (-1%), (-2%), (-5%), and (-7%) respectively in 2022.
- Across the world, 255 billion mobile apps were downloaded in 2022 which was an increase of 11% from the previous year.
Average Monthly Hours on Mobile Apps Statistics by Age Group
 (Source: cellphonedeal.com)
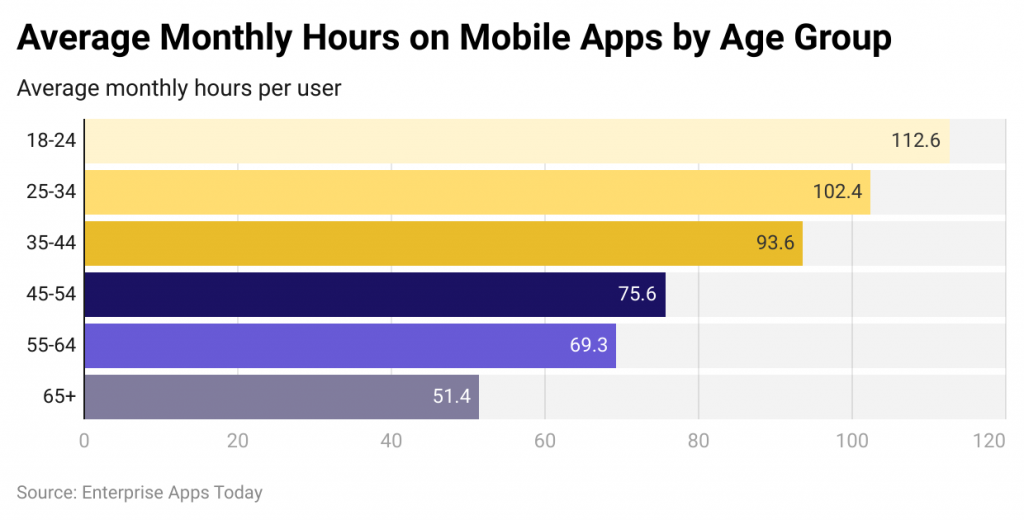
- Globally, people spent an average of 3 hours and 47 minutes per month on mobile apps on their phones.
- For 18 to 24-year-olds, the average monthly time spent on mobile apps was 112.6 hours.
- 25 to 34-year-olds spent an average of 102.4 hours per month on mobile apps.
- In the 35 to 44 age group, the average monthly usage was 93.5 hours.
- People aged 45 to 54 spent an average of 75.6 hours per month on mobile apps.
- For 55 to 64-year-olds, the monthly average was 69.3 hours.
- Those 65 years and above spent an average of 51.4 hours per month on mobile apps.
by User Retention
- In 2022, because of too much memory consumption, 50.6% of users have uninstalled apps.
- After using apps for three months around 62% of people have uninstalled apps because of errors and crashes in apps.
- Due to the long loading time of downloading 25% of users have abandoned apps.
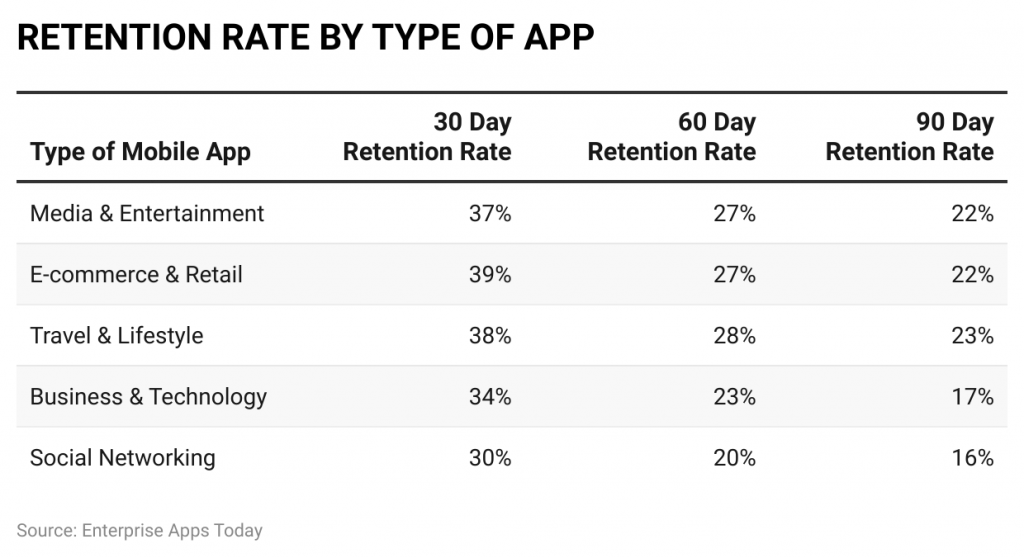
- The highest retention rate of apps has been seen on e-commerce and retail apps such as Amazon, Etsy, and many others in which users mostly uninstalled apps after using 30 days.
Retention Rate Statistics by Type of Apps
 (Source: zippia.com)
Popular Apps Statistics in the United States
- Instagram: 72 million users.
- Cash App: 64 million users.
- WhatsApp: 63 million users.
- Snapchat: 54 million users.
- Subway Surfers: 51.4 million users.
- Roblox: 50.9 million users.
- Amazon: 47 million users.
- Messenger: 46 million users.
- Facebook: 45.5 million users.
Popular Apps Statistics in the World
- TikTok: It has a massive user base of 672 million people worldwide.
- Instagram: This social media platform boasts 548 million users globally.
- Facebook: The widely-used social network has 449 million users around the world.
- WhatsApp: The popular messaging app has 424 million users across the globe.
- Capcut: A video editing app with 357 million users globally.
- Snapchat: This multimedia messaging app is used by 330 million people worldwide.
- Telegram: The messaging app has 310 million users worldwide.
- Subway Surfers: The mobile game has a whopping 304 million players globally.
- Stumble Guys: An online multiplayer game with 254 million players worldwide.
- Spotify: The music streaming service has 28 million users worldwide.
Popular category apps Statistics on the Apple App Store and Google Play Store
- Games:
- Apple App Store: 462,065 apps
- Google Play Store: 422,582 apps
- Business:
- Apple App Store: 220,716 apps
- Google Play Store: 167,846 apps
- Education:
- Apple App Store: 190,219 apps
- Google Play Store: 267,657 apps
- Lifestyle:
- Apple App Store: 188,025 apps
- Google Play Store: 122,912 apps
- Entertainment:
- Apple App Store: 123,302 apps
- Google Play Store: 143,707 apps
- Food and Drink:
- Apple App Store: 88,673 apps
- Google Play Store: 11,874 apps
- Travel:
- Apple App Store: 81,178 apps
- Google Play Store: 68,768 apps
- Health:
- Apple App Store: 78,764 apps
- Google Play Store: 91,743 apps
- Productivity:
- Apple App Store: 70,646 apps
- Google Play Store: 100,458 apps
- Shopping:
- Apple App Store: 64,942 apps
- Finance:
- Apple App Store: 55,508 apps
- Google Play Store: 82,446 apps
- Social:
- Apple App Store: 51,120 apps
- Google Play Store: 48,710 apps
- Books:
- Apple App Store: 47,333 apps
- Google Play Store: 121,452 apps
- Sports:
- Apple App Store: 46,732 apps
- Google Play Store: 47,290 apps
- Photo and Video:
- Apple App Store: 43,221 apps
- Medical:
- Apple App Store: 42,124 apps
- Google Play Store: 40,638 apps
- News:
- Apple App Store: 39,053 apps
- Google Play Store: 43,157 apps
- Navigation:
- Apple App Store: 23,037 apps
- Google Play Store: 32,273 apps
Mobile App Industry Statistics at a Glance
 (Source: ghost-en.appbooster.com)
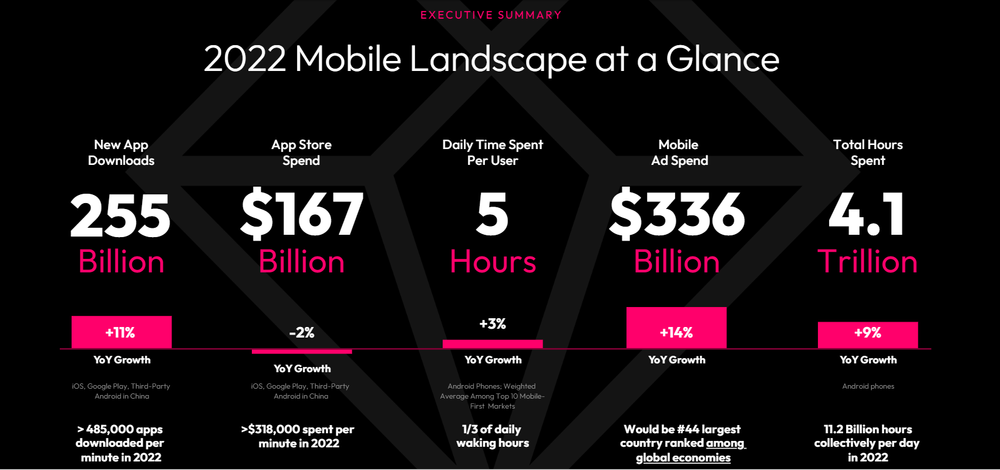
- In 2022, across the world, around 255 billion new apps were installed which has increased by 11% from last year.
- The investment in app stores has decreased by 2% in 2022 resulting in $167 billion.
- The daily mobile app used per user was 5 hours in 2022 which has increased by 3% from last year.
- By the end of 2022 total number of hours spent on mobile apps was 4 trillion.
Category Mobile App Industry Statistics Engagement Hours and Downloads
Engagement Hours of Apps in the United States (January-September 2022)
- Tour Booking and Ticket Services Apps: Users spent 197% more time using these apps.
- Airline App: Engagement increased by 176%.
- Landmark App: Users engaged with this app 134% more.
- Flight Ticketing App: Engagement hours increased by 114%.
- Flight Booking App: Users spent 82% more time on this app.
- Stress Reduction and Meditation App: Engagement increased by 51%.
- E-commerce App: Users spent 23% more time using e-commerce apps.
Percentage of App Downloads by the 3rd Quarter of 2022
- Booking App: Downloaded 180% more.
- Ticket Service App: Downloaded 144% more.
- Flight Ticketing App: Downloaded 86% more.
- Airline App: Downloaded 85% more.
- Maps and Landmarks App: Downloaded 77% more.
- Travel Guide App: Downloaded 74% more.
- Sports News App: Downloaded 65% more.
- Travel Services App: Downloaded 62% more.
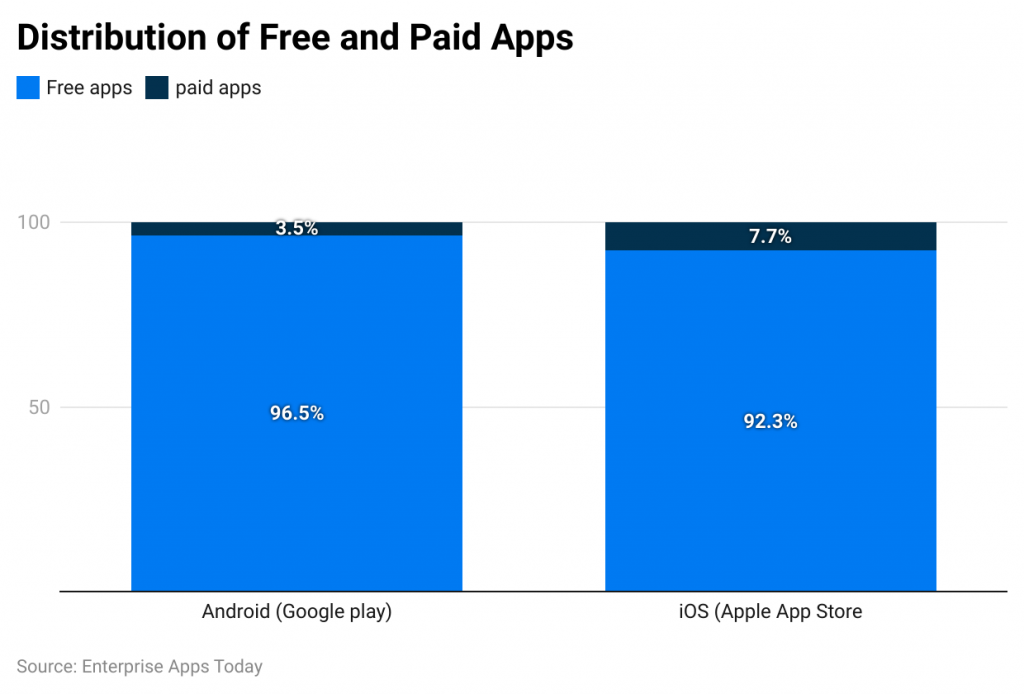
Distribution Statistics by Free and Paid Apps
 (Source: ideausher.com)
- In 2022, Google Play stores (Android) have 3,760,609 apps and Apple app store (iOS) have 1,745,556 apps.
- Android has 96.5% free apps and 3.5% paid apps.
- iOS has 92.3% free apps and 7.7% paid apps.
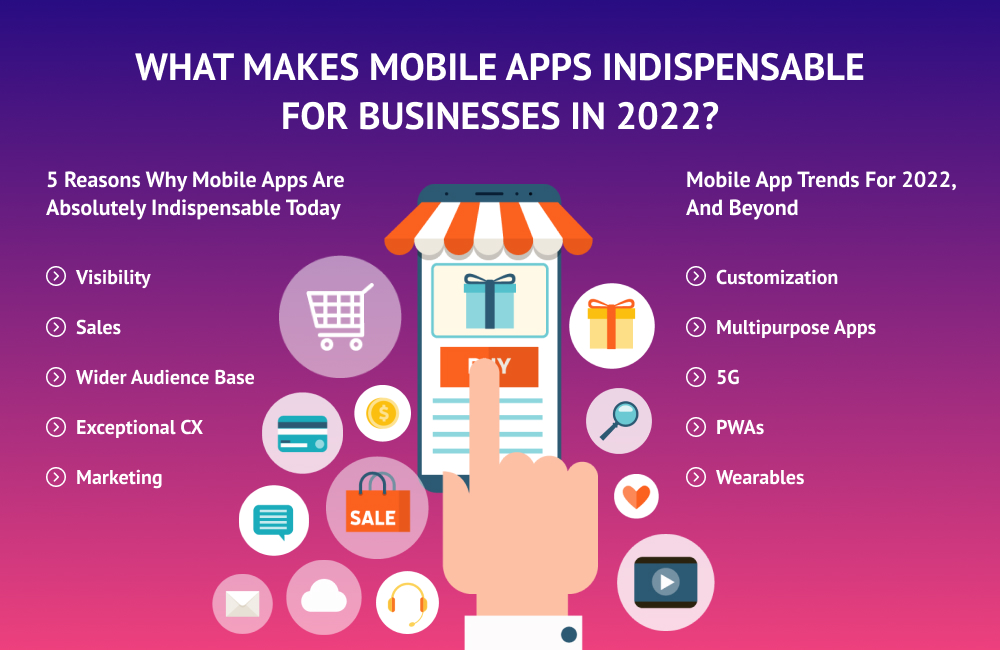
Mobile Apps Importance Statistics for Businesses
 (Source: qualdev.com)
Conclusion
As of today after completing the article on Mobile App Industry Statistics it is clear that the industry is expanding at a fast pace by the end of 2022 and is expected to grow enormously in the coming future. These days’ mobile apps are being used by people regularly in their everyday life starting from shopping, booking tickets, entertainment, and others. The mobile app industry has enabled many opportunities for improving and enhancing many business sectors. This article includes many important statistics that will help you understand important facts about different app categories over the world and the United States.
Sources
FAQ.
TikTok, Instagram, Facebook are the top three popular mobile apps which are free apps and available in both Apple App Store and Google Play Store in 2022.
There are 3 types of mobile apps are currently available such as mobile web apps, native apps, and hybrid apps.
As of mobile app industry statistics, an average smart phone user spends around 3 hours and 10 minutes and in which 2 hours and 51 minutes on different apps per day.

Barry is a lover of everything technology. Figuring out how the software works and creating content to shed more light on the value it offers users is his favorite pastime. When not evaluating apps or programs, he's busy trying out new healthy recipes, doing yoga, meditating, or taking nature walks with his little one.