
Cable TV Subscribers Statistics 2024 – By Countries, Region, Revenue Market Share And Platform

Page Contents
- Introduction
- Editor’s Choice
- Facts About Cable TV Subscribers
- General Statistics
- Cable TV Household Statistics
- Pay TV Household Statistics
- Leading Cable TV Service Provider
- Global Broadcasting and Cable TV Market Statistics
- Cable TV Penetration Statistics by Platform
- Most Watched Cable TV Network or Channel by Number of Viewers
- Recent Development Of Cable TV Subscribers
- Conclusion
Introduction
Cable TV Subscribers Statistics unveils a wealth of insights into consumer behaviors and industry trends. In recent years, the landscape of television consumption has undergone significant transformations, with streaming services and digital platforms reshaping traditional cable subscriptions. According to recent data from reputable sources such as Statista, the total number of Cable TV Subscribers in the United States stood at approximately 75 million as of 2023, marking a decline from previous years. This shift is indicative of changing preferences among viewers, as more individuals opt for alternative means of accessing entertainment content.
Amidst this transition, understanding the nuances of subscriber demographics and consumption patterns becomes paramount for stakeholders within the television industry. As we navigate through the intricacies of Cable TV Subscribers Statistics, we gain valuable insights that inform strategic decision-making and drive innovation in an ever-evolving market landscape.
Editor’s Choice
- As of 2023, 72.2 million cable TV subscribers were recorded, marking a decrease from 98.7 million in 2016.
- The global Pay TV market is forecasted to grow from USD 184.09 billion in 2022 to USD 209.01 billion by 2030, with a steady rise in revenue.
- In the United States, there are 1,775 total television stations and approximately 5,200 cable systems operated by 660 operators, reaching 90% of the entire population.
- Comcast's cable pay-TV business experienced a loss of 2 million subscribers in 2022, a notable increase from 1.66 million in 2021.
- 82% of US adults streaming internet TV find it more entertaining than cable, indicating a strong preference for digital platforms.
- 48% of Americans continue to pay for cable TV subscriptions despite the availability of alternative options.
- Comcast leads in subscribers with 17,144,000, surpassing Charter with 15,495,000 subscribers.
- NBC, with 5.1 million viewers, narrowly edged out CBS in 2022 to lead in total viewership.
- Traditional TV viewing only constitutes 28% of media consumption, highlighting the shift towards digital alternatives.
- Cable TV viewing is projected to decline by 28% annually, reflecting changing consumer habits.
- In 2022, only 68% of Americans had cable television subscriptions.
- Approximately 6 million Americans canceled their cable subscriptions in 2020, demonstrating a significant trend away from traditional TV.
- Over 50% of Americans still opt for cable TV services in 2022, suggesting that while alternatives are gaining popularity, cable TV remains a relevant choice for many consumers.
- The United States boasts close to 1,800 TV stations, providing a diverse array of programming options.
- AT&T emerges as a dominant provider of cable TV services in the US market.
- The adult segment continues to rely on cable TV over streaming services, indicating varying preferences among demographics.
- China holds the largest share of cable TV subscribers globally, followed by Latin America.
- Sky Europe amassed over 14 million subscribers in 2022, contributing to the region's significant paid TV subscription growth.
- Europe has witnessed a substantial increase in paid TV subscriptions, reflecting a broader global trend towards digital content consumption.
You May Also Like To Read
- Video Game Industry Statistics
- Mobile Commerce Statistics
- Business Intelligence Statistics
- Mobile App Industry Statistics
Facts About Cable TV Subscribers
- As of 2022, Comcast a sector of traditional cable TV had experienced a loss of 2 million subscribers resulting in 16.1 million subscribers; the rate of decline has increased from last year.
- The major fall in cable TV subscribers across the world is expected to be observed from 2022 to 2026 with a 28% decline resulting in only 57.2 million.
- The United States was having approximately 1,775 television stations with more than 5,200 cable systems.
- The number of annual cable TV subscriptions has decreased by 5% across the world in 2022.
- As of 2023, the largest cable TV provider in the United States is Xfinity and this channel costs 18% more expenses for TV services, types of equipment, and broadcast fees which the cable revenue has grown by 1.4% resulting in USD 16.4 billion.
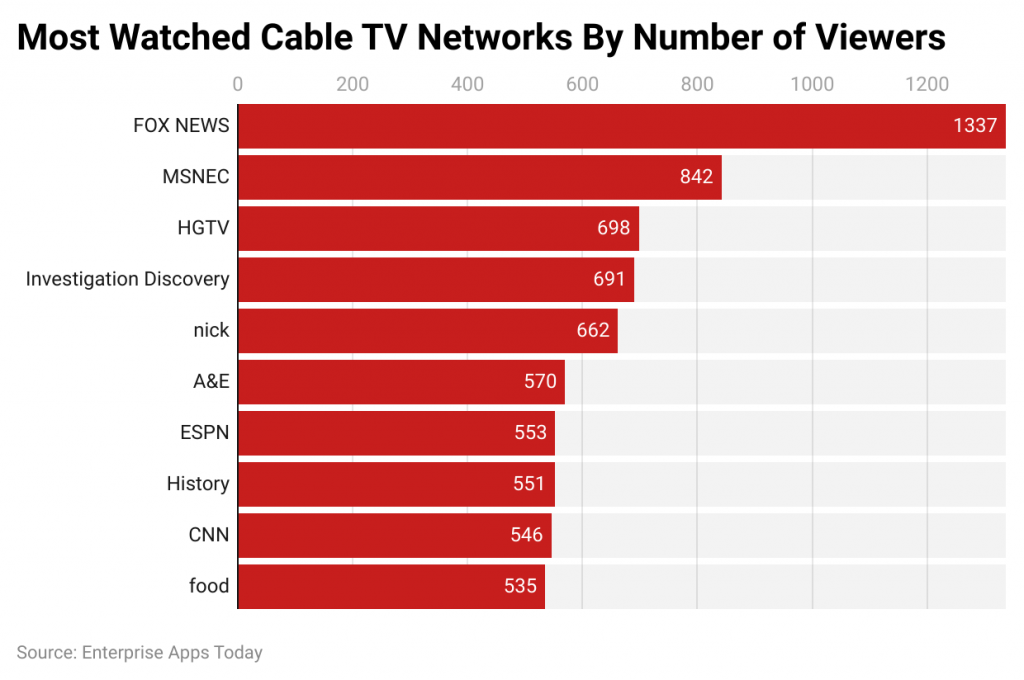
- The most watched channel in the U.S. was NBC with approximately 5,148 million viewers in the maximum number of viewers were between 18 – 49 years old, CBS = 5,144 million viewers, and ABC = 3,867 million viewers.
- According to the survey, it has been observed that 45% of U.S. cable TV subscribers have canceled their subscriptions and 66% of subscribers complained about not receiving fair deals.
- The growth rate of broadcast and cable TV in 2030 will be expected to be 3.9%.
General Statistics
- The annualized growth rate for cable TV subscriptions from 2019 to 2024 stands at -5.8%, indicating a consistent decline in subscriber numbers over the years.
- Factors contributing to the decline include the widespread availability of high-speed internet connections, decreased per capita disposable income, and the emergence of popular streaming services like Netflix and Hulu.
- The recession in 2008-2009 significantly slowed the growth of cable TV subscriptions, reflecting the impact of economic downturns on consumer spending habits.
- However, the COVID-19 pandemic accelerated consumers' transition to cable TV subscriptions, driven by major networks launching their streaming services to cater to changing viewing habits.
- Cable TV subscriptions are projected to continue decreasing annually at a rate of 5.8% until 2024, highlighting the ongoing challenges faced by traditional cable providers in retaining subscribers.
- The impact of cable TV subscriptions extends to various industries in the US, including Satellite TV Providers, Cable Providers, Media Streaming, Social Networks, Video Postproduction Services, and Mail Order, illustrating the interconnectedness of the television industry with other sectors of the economy.
- In 2024 it is expected that the number of subscribers and unsubscribes of cable TV will turn out to be equal and by the end of the year, non-paying TV households will take over the position of paid TV households.
- In 2022, the largest pay cable TV provider has lost almost 5.8 million net video subscribers across the world.
- The TV penetration rate of cable and satellite is predicted to be decreased by 7% by the end of 2030.
- Households by 86.72% in the United States were cable TV subscribers those were having USD 150,000 annual income.
- In 2022, around 4.9 million subscribers around the world have cut out their cable and satellite cord which is around 10.3%
- The viewing of traditional TV for media consumption was 28% and around 68% of American people have used cable TV by the end of 2022.
(Source: prnewswire.com)
Reason For Subscribing To Cable TV
- As of 2022, people watched live sports = 19.50%
- Entertainment events = 11.66%
- Due to too slow internet connection =10.09%
- Watching live news on channels such as MSNBC, CNN, Fox News channels, etc = 9.53%
- Cable providers forced to get subscriptions = 8.23%
- As streaming services subscriptions are too higher = 8.02%
- DVR access = 6.98%
- Cable connection subscriptions were free because of internet connection = 6.71%
- Cable is much easier than other streaming services = 6.43%
- Watched political content such as debates, trials, and hearings = 2.7%
Cable TV Household Statistics
 (Reference: statista.com)
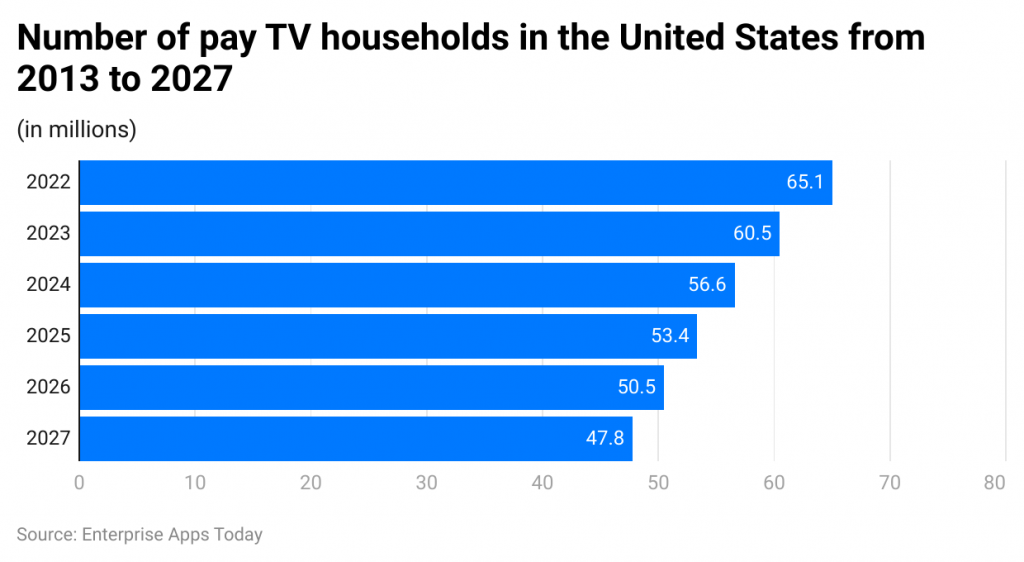
- In the United States in 2022, the household users of TV subscribers were 65.1 million, and recently by 2023, the user rate is going to decrease to 60.5 million.
- By the end of 2024 = 56.6 million, 2025 = 53.4 million, 2026 = 50.5 million, 2027 = 47.8 million
Cable TV Subscribers Statistics by Age
- As of 2022, in the United States the cable TV subscriber aged between 18 – 37 years = 46% of cable TV subscribers.
- 37 – 48 years = 48%
- 49 – 64 years = 55%
- 65+ years = 81%
- 68+ years = 63%
Cable TV Subscribers Statistics by Countries
- By 2022, China was having the top cable TV subscribers with 324 million.
- India ranks 2nd with 112 million subscribers of cable TV in 2022.
- According to Statista, by the end of 2023, it is expected that in Eastern Europe there will be above 78 million digital cable pay-TV homes.
- Whereas, in 2022, Sky Europe is the leading cable pay-TV operator, which was having almost 22.666 million subscribers. In the 2nd quarter of 2022, the un-subscription number resulted out 361,000.
- By 2023 the cable TV revenue of Latin America is expected to be USD 14.9 billion and by 2024 it will be USD 17.82 billion.
Cable TV Subscribers Statistics by Region
- In 2022, Latin America = 83.5 million
- North America = 102 million
- Sub-Saharan Africa = 6.7 million
- MENA = 19.5 million
- Western Europe = 105.8 million
- Asia Pacific = 666 million
Statistics by Number of Cable TV Subscriptions
- Comcast’s cable pay TV has lost almost 2 million subscribers in 2022 and in 2023 around 48% people of in the U.S. is still paying for cable TV and Comcast itself is having 17,144,000 subscribers.
- As of 2023 in the United States, the Satellite TV provider is expected to be USD 46.8 billion with a growth rate of 2.2%.
- The industry of cable providers in the U.S. is USD 105.8 billion with a growth rate of 3.4%.
- The industry of media streaming, social networks, and other content providers in the U.S. is $109.6 billion with an increase of 2.9%
- Video postproduction services subscription is expected to be USD 5.7 billion with an increase of 5.6%
- Mail order subscription is $216.5 billion with an increase of 1.8%
Pay TV Household Statistics
 (Source: insiderintelligence.com)
- In the U.S. the subscription rate of pay cable TV has fallen in 2022 and it is expected that many families are going to cut out the cable cord by the end of 2023.
- As of 2023, the pay cable TV household number has dropped by 4.8% resulting in 65.1 million.
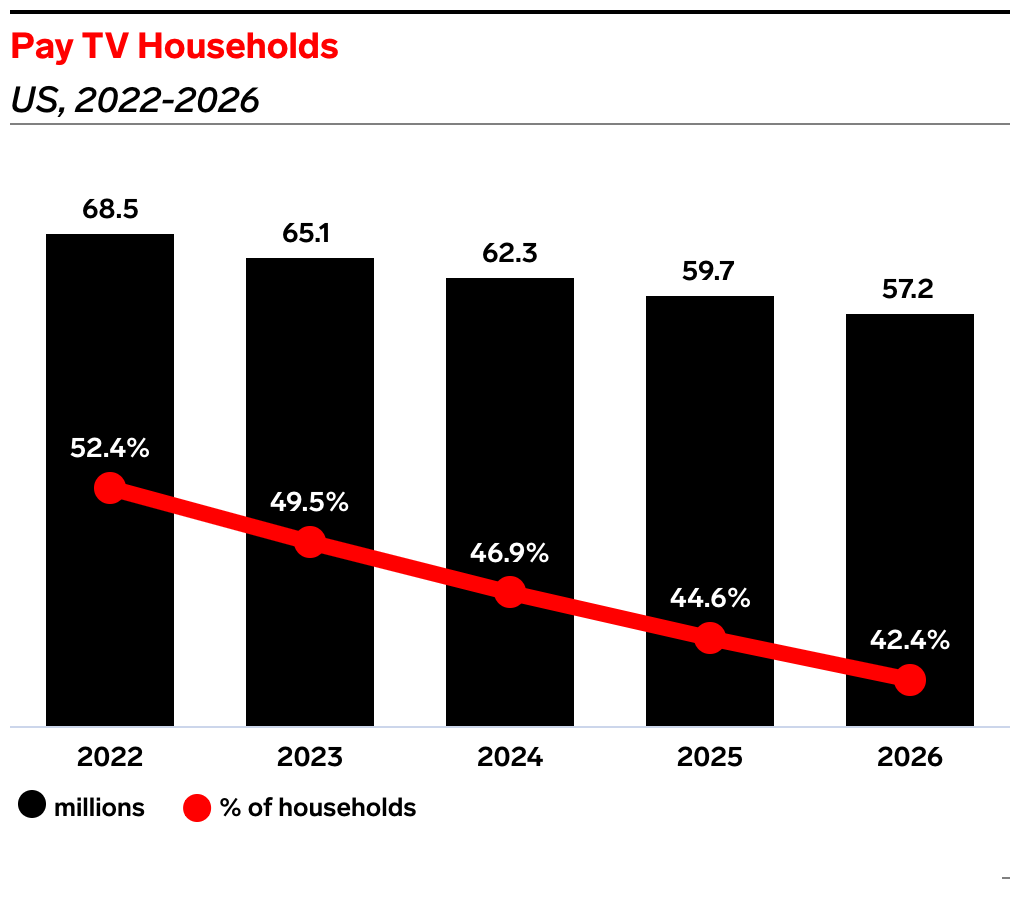
- According to the above graph in 2022, pay-TV households had lost 68.5 million viewers (or 52.4% of households)
- By 2023 it is expected that cable TV will lost 65.1 million viewers (or 49.5% of households)
- 2024 = 62.3 million viewers (or 46.9% of households)
- 2025 = 59.7 million viewers (or 44.6% of households)
- 2026 = 57.2 million viewers (or 42.4% of households)
Reasons For Decreased Cable TV Subscribers
- The price was one of the main factors for subscribers in 2022 which has increased by 86.7%
- Increased preferences for streaming = 39.7%
- People started to switch towards antennae TV = 23%
- Increased binge-watching preferences = 15.9%
- Renewing services was an issue = 13%
- Increased preferences for original content on streaming services = 7.7%
Leading Cable TV Service Provider
 (Reference: cablecompare.com)
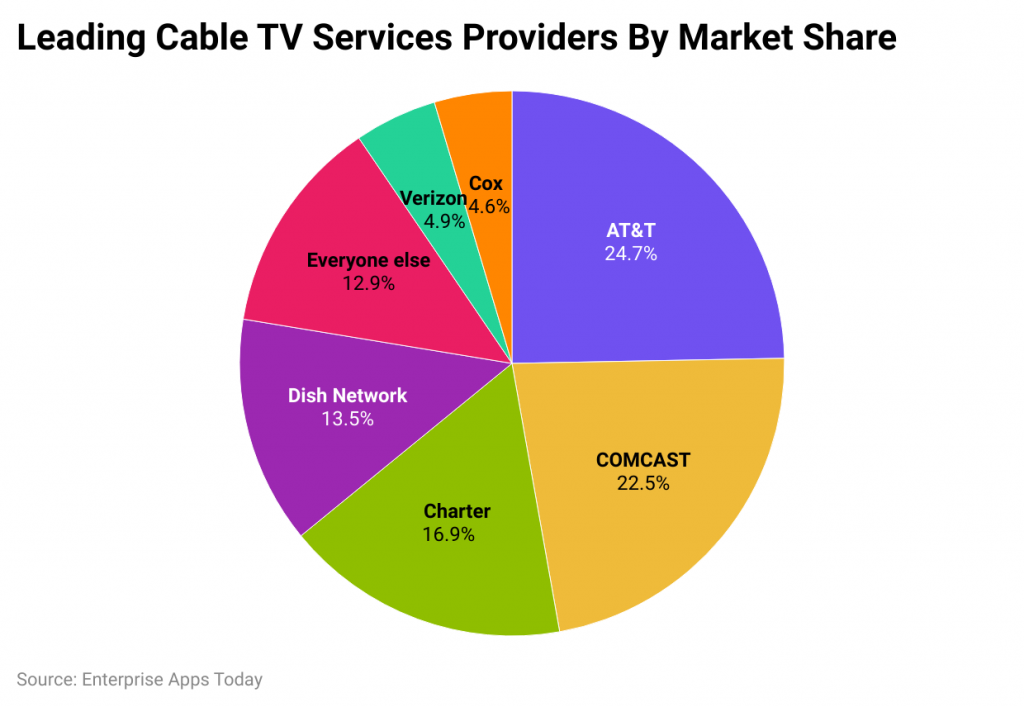
- The above image describes the major service provider of cable TV in the United States in 2022.
- The market size of AT&T = 24.7% and subscribers = 22 million
- Market share of Comcast = 22.5% and subscribers = 20 million
- Market share of Charter = 16.9% and subscribers = 15 million
- Market share of Dish Network = 13.5% and subscribers = 12 million
- Market share of Verizon= 4.9% and subscribers = 4.4 million
- Market share of Cox = 4.6% and subscribers = 4.1 million
- Market share of Everyone else = 12.9% and subscribers = 11.4 million
Global Broadcasting and Cable TV Market Statistics
 (Reference: maximizemarketresearch.com)
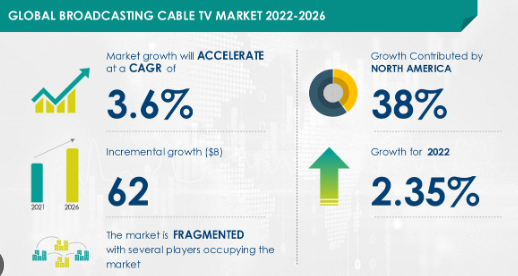
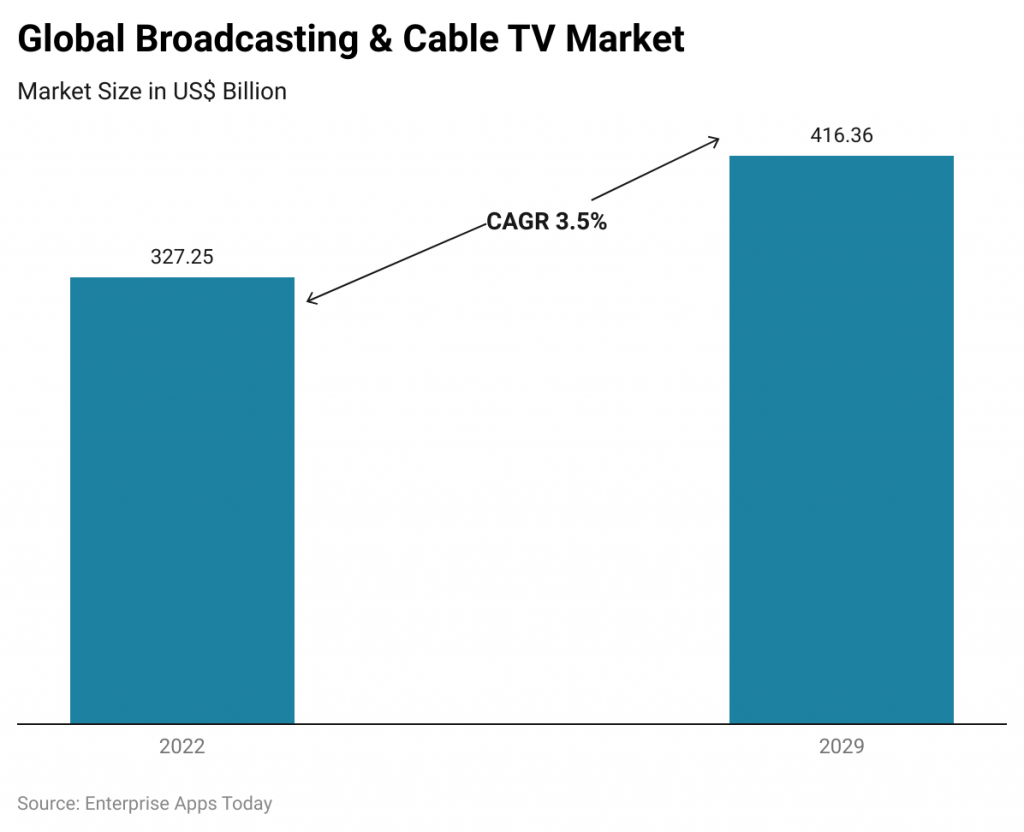
- The global market size of broadcasting and cable TV in 2022 was USD 327.25 billion.
- By the end of 2029, the market size is expected to be USD 416.36 billion which will increase by 3.5% of CAGR.
- In 2022 the North American region was having the largest market share with 44%, followed by Europe, Asia Pacific, Middle East and Africa, and South America.
- On the basis of technology, the segment of satellite TV was having 43.2% share in 2022.
(Source: mountain.com)
Cable TV Penetration Statistics by Platform
 (Reference: giiresearch.com)
- As of 2022, the pay cable TV penetration in the United States will be reduced by 50% by the end of 2024.
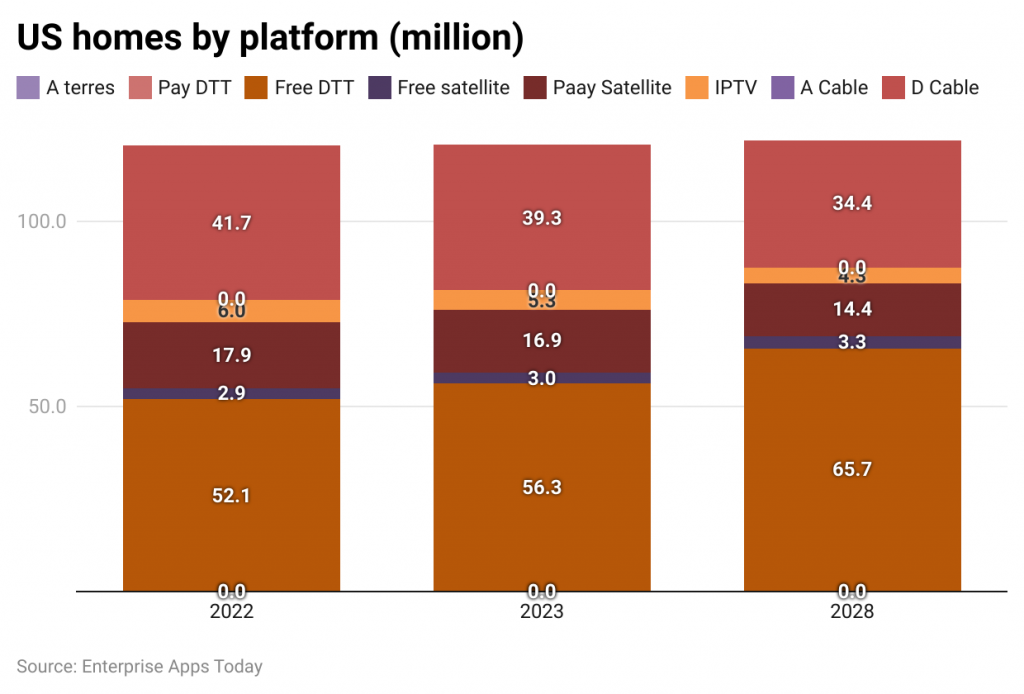
- In 2022, Free DTT cable TV subscribers were 52.1 million, Free satellite = 2.9 million, Pay satellite = 17.9 million, IPTV = 6 million, and D cable = 41.7 million.
- As of 2023, the number of TV subscriptions was expected in Free DTT = 56.3 million, Free satellite = 3 million, Pay satellite = 16.9 million, IPTV = 5.3 million, and D cable = 39.3 million
- By the end of 2024 the subscriptions of platforms, Free DTT = 65.7 million, Free satellite = 3.3 million, Pay satellite = 14.4 million, IPTV = 4.3 million, and D cable = 34.4 million.
Most Watched Cable TV Network or Channel by Number of Viewers
 (Reference: cablecompare.com)
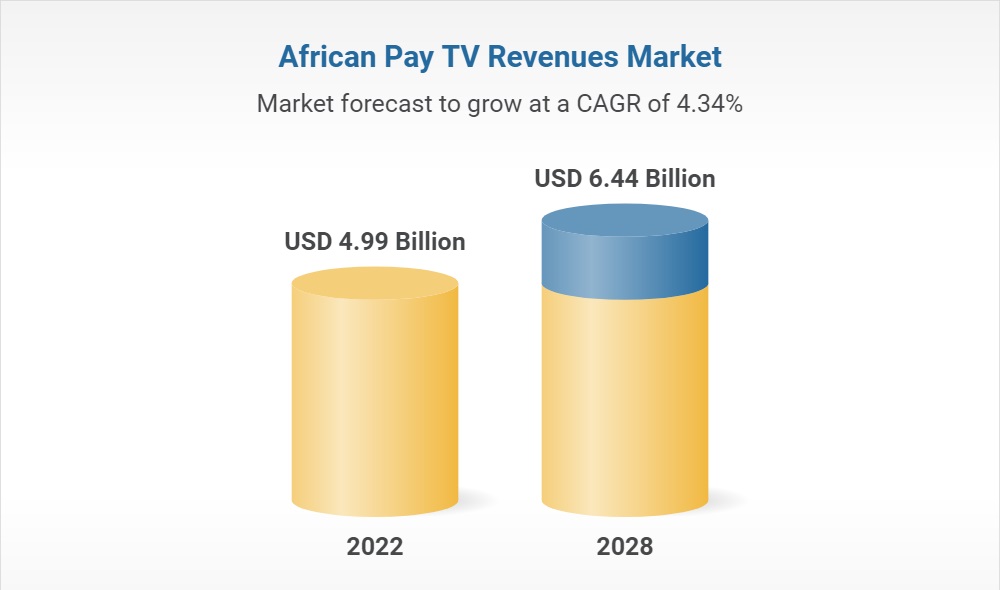
African Cable Pay TV Revenue Market Share
 (Source: researchandmarkets.com)
- In 2022, the number of subscriber count has increased by 38% by the end of 2022 and revenue was resulted to be USD 4.99 billion and expected to be USD 6.44 billion by the end of 2028 with a growth of 4.3% of CAGR.
Western Europe Cable TV Subscribers Statistics by Country
- In 2022, Netherlands = 6.5 million
- Spain = 6.4 million
- UK = 14.1 million
- France = 22.8 million
- Germany = 24.3 million
- Others = 31.4 million
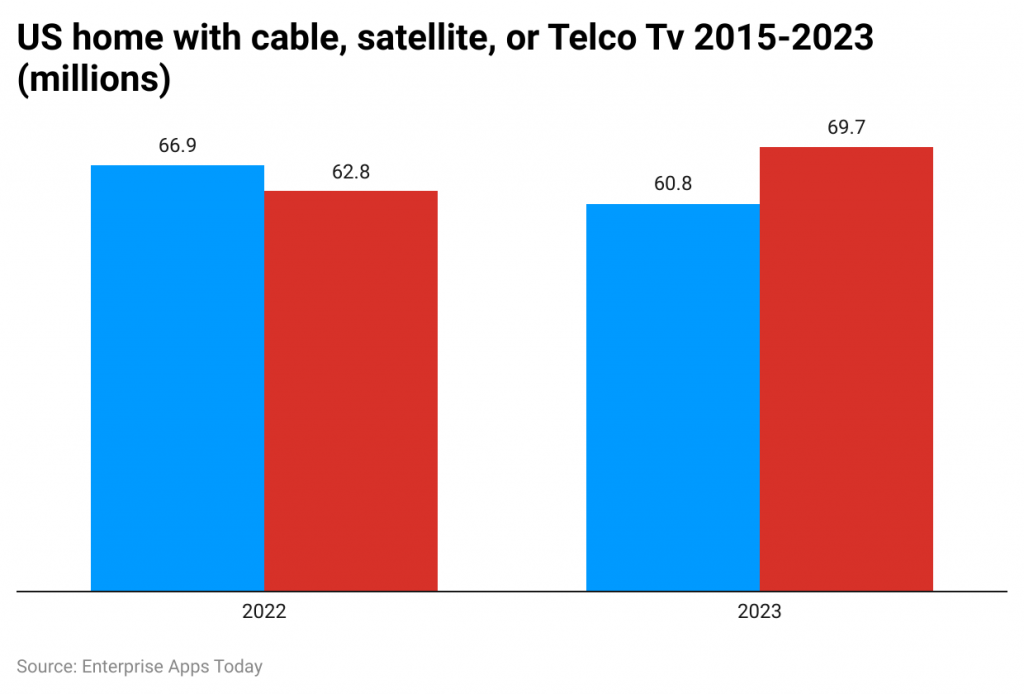
U.S. Homes With Cable TV Statistics
 (Reference: nscreenmedia.com)
- As of 2022, in the United States, the traditional pay cable TV homes were 66.9 million, and homes without traditional pay cable TV were 62.8 million.
- As of 2023, the traditional pay cable TV homes =60.8 million and homes without traditional pay cable TV = 69.8 million.
- In February 2022, U.S. adults currently subscribed = 42%, Subscribed in the past = 38%, and never subscribed = 20%
Recent Development Of Cable TV Subscribers
- Factors such as the proliferation of high-speed internet, reduced disposable income, and the popularity of streaming services like Netflix and Hulu contribute to this decline.
- The COVID-19 pandemic initially saw a spike in cable TV subscriptions as major networks launched streaming services, but the trend may not be sustainable as consumers adapt to new viewing habits.
- Cable TV providers are exploring new strategies to retain subscribers, including bundling services with internet and phone plans and investing in original content production.
- Some cable companies are shifting focus towards broadband services, leveraging their infrastructure to meet the growing demand for high-speed internet access.
- The industry faces increasing competition from streaming platforms and alternative entertainment sources, prompting cable providers to innovate and adapt to changing consumer preferences.
Conclusion
In conclusion, examining the landscape of Cable TV Subscribers Statistics provides valuable insights into the evolving dynamics of the television industry. The decline in cable TV subscribers, coupled with the steady rise in digital streaming preferences among consumers, underscores the need for cable providers to adapt their strategies to remain competitive in a rapidly changing market. Despite the challenges, the Cable TV market, projected to be worth USD 209.01 billion globally by 2030, presents opportunities for innovation and growth. As 82% of US adults find internet TV more entertaining than cable, there is a clear indication of shifting consumer preferences towards digital platforms.
However, with 48% of Americans still subscribing to cable TV services, there remains a significant market segment to be catered to. Market research analysts play a crucial role in deciphering these trends, helping stakeholders navigate the complexities of the industry and capitalize on emerging opportunities. As the landscape continues to evolve, a nuanced understanding of Cable TV Subscribers Statistics will be essential for businesses to thrive in the digital era.
Sources
FAQ.
Since last year 2022, the rate of cable TV has started losing more customers with 72.2 million subscribers which was 76 million subscribers in 2023. The subscription rate is expected to decrease in the coming years. The largest cable TV subscription was the largest in the United States Comcast cable operator with over 17 million subscribers.
The connections of cable TV allow in transmitting analog signals from different television stations that based on the receiving antenna over particular frequency.
The subscription rate of streaming services has increased over cable TV subscription in last few years. As of reports 56% of American have subscribed cable TV but 76% of U.S. have subscribed to Netflix, Amazon Prime, and other streaming networks by the end of 2022.

Barry is a lover of everything technology. Figuring out how the software works and creating content to shed more light on the value it offers users is his favorite pastime. When not evaluating apps or programs, he's busy trying out new healthy recipes, doing yoga, meditating, or taking nature walks with his little one.