
Robotics Industry Statistics 2024 – By Industry And Facts
Page Contents
- Introduction
- Editor’s Choice
- Impacts of the Robotics Industry
- Facts About Robotics Industry
- General Robotics Industry Statistics
- Robotics Industry Statistics By Automotive Industry
- Robotics Industry Statistics By Non-Automotive Industry
- Robotics Industry Statistics By Electric/Electronic Industry
- Robotics Industry Statistics By Agriculture Industry
- Robotics Industry Statistics By Healthcare Industry
- Robotics Industry Statistics By Food Industry
- Robotics Industry Statistics By Chemical Industry
- Robotics Industry Statistics By Educational
- Robotics Industry Statistics By Retail Industry
- Conclusion
Introduction
Robotics Industry Statistics: The robotics sector has witnessed an unprecedented surge in recent years, with global spending on robotics and related services reaching a staggering $98.4 billion in 2023, reflecting a remarkable 27% increase from the previous year. This surge is indicative of the growing integration of robotic technologies across various sectors, from manufacturing to healthcare, as organizations seek to enhance efficiency and productivity while reducing operational costs.
Furthermore, projections suggest that the robotics market is poised for sustained growth, with estimates indicating that global spending could surpass $200 billion by 2028. Such projections underscore the pivotal role that robotics is poised to play in shaping the future of industries worldwide, driving innovation and transformation at an unprecedented scale. These Robotics Industry Statistics are based on several aspects that will provide a better understanding of why Robotics is one of the largest markets today.
Editor’s Choice
- The global robotics industry revenue is projected to reach $43.32 billion by 2027.
- Asia commands over one-third of the global robotics industry revenue.
- Currently, there are over 3.4 million industrial robots worldwide.
- In manufacturing, the global robot-to-human ratio stands at 1 to 71.
- Industrial companies are planning to allocate 25% of their capital to industrial automation over the next five years.
- Around 14% of workers have lost their jobs to robots.
- Revenue from service robotics surged by over $16 billion from 2016 to 2023.
- The AI robot market size is expected to reach $184.75 billion by 2023.
- The mobile cobots market is forecasted to reach $7.66 billion by 2030.
- China leads in new industrial robot installations.
- Palletization and packaging are the top use cases for industrial automation.
- Quality is the primary perceived positive impact of industrial automation.
- 3 in 20 workers have lost their jobs to robots.
- 65% of robotics engineers hold a bachelor’s degree.
- Over half of robotics engineers work at companies with 500 or fewer employees.
- The unemployment rate for robotics engineers stands at 2.3%.
- The global robotics market is projected to reach $45.85 billion in 2024, with a forecasted growth rate of 15.91% to reach $95.93 billion by 2029.
- Major companies in the robotics market include ABB Ltd, Yaskawa Electric Corporation, Denso Corporation, Fanuc Corporation, and Kuka AG.
- The robotics market is segmented into industrial and service robots, with various end-users such as automotive, food & beverage, electronics, logistics, military and defense, and medical and healthcare.
- The Asia-Pacific region holds a significant market share in the robotics industry, with countries like South Korea and China leading in adoption.
- Investment in robotics is increasing due to factors like Industry 4.0 and the need for enhanced productivity.
- Innovations like collaborative robots (cobots), artificial intelligence (AI), and autonomous mobile robots (AMRs) are shaping the future of the robotics market.
- Robotics are being increasingly utilized in various sectors including manufacturing, healthcare, logistics, and domestic tasks to improve operations.
You May Also Like To Read
Impacts of the Robotics Industry
- Due to improvements in R&D and high technology adoption, the industrial robots market in North America is expected to increase significantly in 2023.
- Using robotics in industries has several advantages, but safety measure is the most prominent one.
- Robotics has improved building industries in several ways, including greater production, decreased errors, meeting deadlines, reduced accidents, and reduced expenses.
- Increases the overall productivity with a robot workforce that offers thorough automation for many important industry operations.
Facts About Robotics Industry
- In 1st quarter of 2023, the U.S. industries placed orders of 9,168 units for $597 million which is a 10% decrease since last year 2022.
- In terms of the number and market value of robots sold, the North American robotics industry achieved historical highs in 2022.
- In 2022, North American companies placed orders for 44,196 robots for $2.38 billion, an increase of 11% and 18% since last year.
- U.S. industries have bought 35,804 robots in the first 9 months and 8,392 robots in the 4th quarter of 2022.
- Orders for robotic units in North America rose by 24% in 2022.
- According to experts, up to 43,000 units of robotics in the U.S. has been installed by the end of 2022.
- In 2022, the U.S. remained the biggest investor in the robotics industry sector.
- Asia commands over one-third of the global robotics industry revenue.
- There are currently over 3.4 million industrial robots worldwide.
General Robotics Industry Statistics
- In 2022 the Americas have dominated the service robotics industry, with a value of over $12 billion.
- Companies with headquarters in the US, Canada, and Mexico installed 20,391 industrial robots in 2022, an increase of 30% from last year.
- The revenue of this industry is going to hit 11.67% by 2026.
- After China, North America has the second-largest operational stock of industrial robots worldwide in 2022.
- The market for electronic and electrical industrial robotics in America is expected to increase by 11.8% in 2023 and is expected to reach $5,855.9 million by 2032.
- In 2022, the implementation of robots increased by 11% since last year because American companies had ordered 44,196 robots in total.
- In the 4th quarter of 2022, the nation's lowest sales rate thus the amounts of robot orders has also decreased to 8,392.
- In the U.S. companies out of 10,000 workers, the average density of robots was 228 units.
- Currently, in the United States, almost 132,500 robotics engineers are present who manages those robotic activities.
- By 2026, the rate of engineers is going to increase by 6.4% in the United States.
- The global robot-to-human ratio in manufacturing stands at 1 to 71.
- Industrial companies are planning to invest 25% of their capital in industrial automation over the next five years.
- Europe leads in commercial service robot revenue.
- The vision-guided robotics market is predicted to be valued at $20.1 billion by 2030.
Robotics Industry Statistics By Automotive Industry
- The robotic installation increased by 14,594 units in the United States as demands for vehicles and equipment manufacturers increased by 48% in 2022.
- Robotics accounts for 40% of all installations which significantly impacted the installation counts in Canada.
- In 2022, around 66% of robot installations were accounted for in Mexico which impacted the sales growth by 16%.
Robotics Industry Statistics By Non-Automotive Industry
- The robotics installation count has also increased in this sector with 4,000 units in North America, in 2022.
- In the electrical/electronic industries robotic installation increased by 28%.
- Metal and machinery decreased by 9%.
- Plastic and chemical installation also decreased by 4%.
- In terms of industrial robot installations, each industry accounts for 9% of the market share in 2022.
Robotics Industry Statistics By Electric/Electronic Industry
- Robotics used in the electric and electronic industries in the United States resulted in around 145.3 million dollars in 2022.
- By 2022, this manufacturing sector’s total number of robotic installations has increased by 12% to 41,624 units in North America.
Robotics Industry Statistics By Agriculture Industry
- The robotics agriculture industry of the U.S. is segmented into automated harvested systems, milking robots, driverless tractors, etc.
- In 2022, the market size of agriculture robots was $7.07 billion in 2022.
- Starting from 2022-2030 the growth of the agricultural robotics industry is expected to gain a CAGR of 19.07 %.
- The nation is going to earn $8489.87 million in net revenue by the end of 2030.
- The maximum market share of the agricultural robotic industry is dominated by North America by the end of 2022.
- American farmers have installed many new robotics developments in agriculture in 2022.
Robotics Industry Statistics By Healthcare Industry
- The U.S. hospital robots market mainly includes autonomous mobile robots, sterilization robots, laboratory robots, and pharmacy robots.
- According to research, the robotic market for medicine in U.S., Canada, and Mexico have reached $6,339.07 million in 2022.
- The market size of hospital robotics is expected to reach $2 billion by the end of 2032.
- The expected market price by 2023 is $15,472.48 million.
- In October 2022, surgical robotics handled more than 50% of the overall healthcare robotics.
- The healthcare robotic market is going to climb $15,472.48 million by 2030.
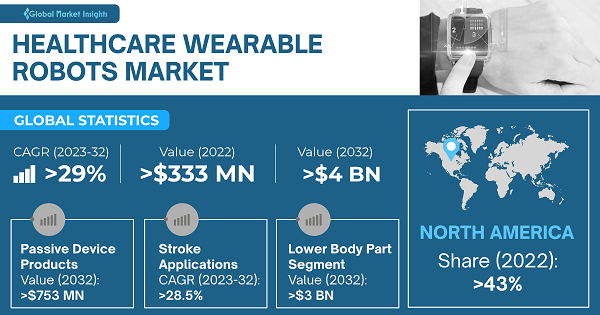
(Source: Gminsights.com)
- The above graph describes the global statistics of the healthcare wearable robotics industry.
- The overall industry has grown to $333 million and is expected to reach a CAGR of 29% above by 2032 with a market size above $4.5 billion.
- The North American market share remained at more than 43% at the end of 2022.
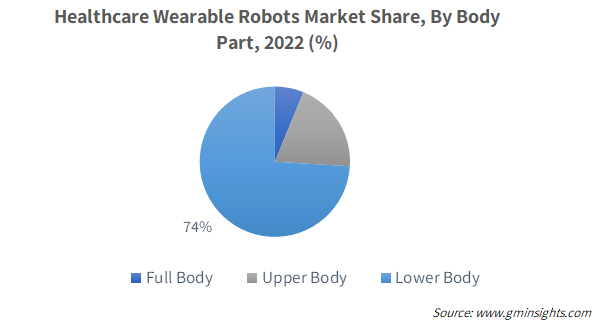
(Source: Gminsights.com)
- This pie chart depicts the robotic industry's share of healthcare departments by body parts in 2022.
- 74% of the robotic application has been used for full body treatment followed by upper body and lower body.
- In 2022, around 43% of healthcare departments in America were managed by wearable robot industries in which ANGEL Robotics played an effective role.
Robotics Industry Statistics By Food Industry
- In 2022, the overall robotic market of food was $2.4 billion and is expected to be $4.5 billion by 2027.
- The food and beverage robotics industry of the United States and Canada has been estimated to $5,787.9 million by 2030.
- From 2022-2031, the CAGR of the food robotics market is accounting for 10.4%
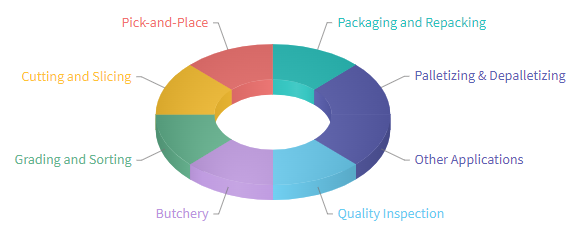
(Source: nextmsc.com)
- The above image describes the segmentation of the food robotics industry.
- This helps in performing different activities such as pick-and-place, cutting, and slicing, grading and sorting, butchery, packaging and repackaging, palletizing and de-palletizing, etc.
- Food robotics is also divided into categories such as cylindrical robots, articulated robots, parallel robots, SCARA robots, collaborative robots, portal robots, etc.
Robotics Industry Statistics By Chemical Industry
- The above graph represents the chemical robotics industry statistics of North America.
- In 2022 the revenue has grown up to $75.45 million and is going to be $77.41 million by 2023 and $85.39 million by 2027.
- The revenue change in 2022 rose by 3% since last year and is expected to be reduced to 2.6% in 2023.
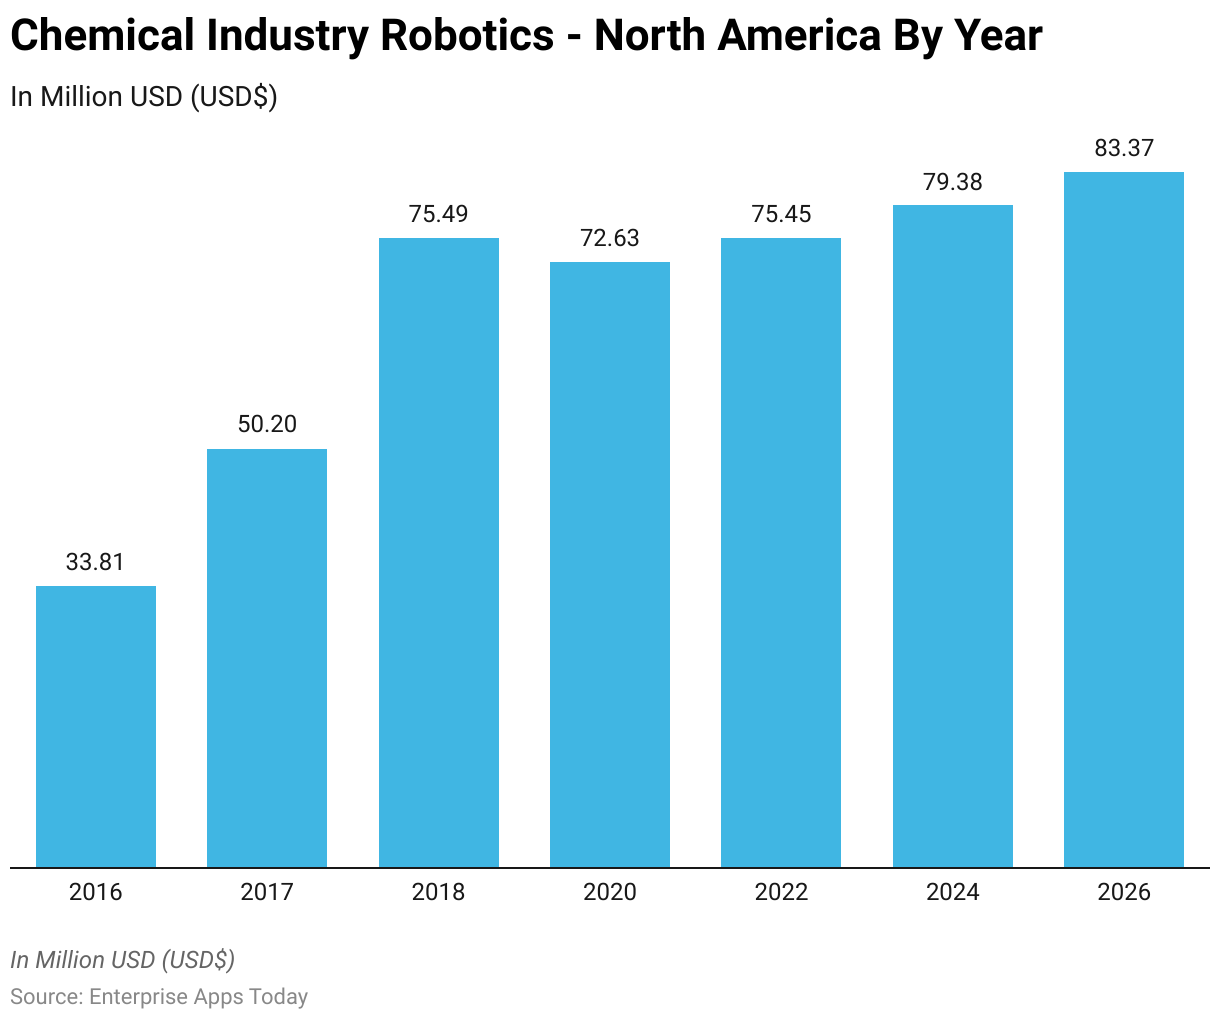
(Reference: statista.com)
- The total number of robots implemented in the U.S. chemical industry was 4.79 thousand in 2022 and the installation number is going to increase by 4K in 2023 resulting in 4.83 thousand.
- February = Orio (an autonomous and electrified agricultural robot) and virtual platform for precision agriculture.
- April = Multiple GUSS sprayers.
- June = Autonomous farming robots.
- December = Ag tech and smart farming technology.
Robotics Industry Statistics By Educational
- The above graph is all about statistics of the educational sector robotics starting from 2022.
- As of 2022, almost 34% of revenue share was made by North American(United States and Canada) educational robot industries
- By 2028, this market is intending to reach 19.2% CAGR in the United States will be resulting in $1,066 million.
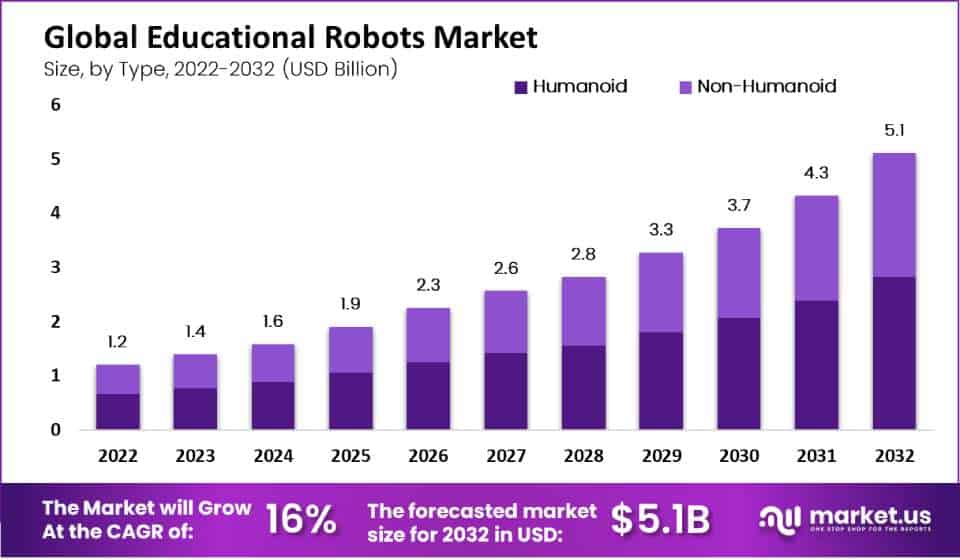
(Source: market.us)
- Educational robotics by type is divided into two segments humanoids and non-humanoids. Whereas by application it is divided into three segments primary, secondary, and higher education.
- In 2022, the maximum revenue was generated from the segment of humanoid.
- The application segment of higher education resulted out 35% of revenue in 2022.
Robotics Industry Statistics By Retail Industry
- The above graph represents the statistics of the retail robotics industry.
- In 2022, U.S., Canada, and Mexico have hovered around 25% of the overall market share.
- The market share of North America is expected to grow at 35% of CAGR in 2023.
- In the retail market of automation North and South America is supposed to gain the highest growth in the coming year.
- Based on type, the market share of mobile robotics was 53.38% in 2022.
- Based on the application, the market share of inventory management was 36.24% in 2022.The above graph describes the statistics of electric drives in North America.
- In 1st quarter of 2023, the U.S. industries placed orders of 9,168 units for $597 million which is a 10% decrease since last year 2022.
- The drive market of America is segmented by types, voltage, and end-user industry.
- According to a study the market is supposed to grow with 6.79% of CAGR by 2028.
Conclusion
In conclusion, the landscape of the robotics industry presents a compelling narrative of growth and innovation. With global revenues soaring and projections indicating substantial future expansion, the sector is poised for continued evolution. Market dynamics such as the significant presence of Asia and the rising adoption of robotics across various sectors underscore the industry's global impact. While statistics reveal the transformative potential of robotics in enhancing efficiency and productivity, they also highlight the ongoing challenges, including workforce implications and technological integration hurdles.
However, with investments projected to increase and advancements in areas like collaborative robots and artificial intelligence, the future of the robotics industry appears promising. As market research analysts, it's essential to monitor these trends closely, providing insights that enable businesses to navigate this dynamic landscape and capitalize on emerging opportunities in the multi-billion-dollar robotics market.
Sources
FAQ.
Robots are machines that have been designed with Artificial Intelligence. When these robots are installed within industries they allows in improvising the manufacturing process. Industrial robots work within a particular production line that can work efficiently, accurately, and faster than human beings even without getting tired. The industrial robots are divided into 5 categories Articulated, SCARA, Delta, Polar, and Cartesian.
The basic advantage of industrial robots are producing higher quality products, they perform consistent and precise work, they help in reducing the chance of risk, allow in increasing the rate of overall productivity, increasing flexibility within the manufacturing process, reducing operational expenses, etc.
Industrial robotics is mainly used in Manufacturing industries, Automation, Electric/electronic, Healthcare industries, Agricultural, Food and beverage processing, Chemical, Retail, Educational, basic metals, industrial machinery, glass and minerals, and many others.

Barry is a lover of everything technology. Figuring out how the software works and creating content to shed more light on the value it offers users is his favorite pastime. When not evaluating apps or programs, he's busy trying out new healthy recipes, doing yoga, meditating, or taking nature walks with his little one.