Targeted Advertising Statistics By Countries, Companies and Platforms
Page Contents
- Introduction
- Editor’s Choice
- Facts About Targeted Advertisement
- Effectiveness of Targeted Advertising
- General Targeted Advertising Statistics
- Market Size Statistics of Global Online Targeted Advertisement
- Targeted Advertising Statistics That Marketers Post vs. Consumers' Wants
- Targeted Advertisement Statistics By Challenges
- Targeted Advertising Infographical Presentation
- Targeted Advertising Statistics by Platforms
- Data Sharing Statistics for Making Targeted Advertisement
- Purchase Statistics Based On Online Ads
- Targeted Advertising Statistics by Text
- Targeted Mobile ad Spending Statistics by Countries
- Targeted Advertisement Statistics by Making Purchasing Decisions
- Social Media Ad Revenue Growth Statistics by Companies
- Conclusion
Introduction
Targeted Advertising Statistics: As of reports in recent days, targeted advertisement has become much more popular over the world as these are the form of digital advertisements. This kind of online advertisement forms depends on the internet as well as on Artificial intelligence and ads are focused on customer’s preferences and interests. By the end of 2022, the targeted advertising industry growth has experienced d growth rate of $209.9 billion. These Targeted Advertising Statistics include several insights from different aspects that will provide a better idea of why Targeted Advertisement is the best ad today.
Editor’s Choice
- The spending on targeted advertising in 2022 has resulted in $4.25 billion
- Companies across the world spent around $521 billion approximately per year on Targeted ads.
- As of 2022, across the global digital ad market, 28.6% was earned by the targeted ads market of Google.
- The targeted ads allowed in generating Facebook’s 99% of revenue.
- Targeted ads revenue generated by Google was $147 billion.
- Yearly $117 billion in revenue is generated from targeted ads from overall Meta’s.
- Targeted advertisement attracted 37% of social media users for buying a product.
- By the end of 2022, the targeted market has experienced a growth of 15% from last year resulting in $602 billion.
- By the end of 2026, the advertising budget for social media is going to grow by 11.76%.
Facts About Targeted Advertisement
- Targeted ads are a convenient way of learning about different products was considered by 27% of internet users whereas, 51% of users didn’t trust this type of advertisement as sharing personal information may cause damage.
- A Google ad is an effective part of the targeted advertisement strategy and in which small business spends around $9000 – $10,000 on a monthly basis.
- In 2022 the spending on social media advertisement accounted to be 33% of the overall digital spending resulting in $134 billion.
- These days digital advertisement helps in targeting people and the types are Pay-per-click ads, Mobile ads, Display ads, Video ads, Influencer ads, and Social media ads.
- Pay-per-click ads allow an increase of 80% in brand awareness and total spending in the United States turned out to be $46 million in 2022.
- As of 2023 mobile advertisement is going to spend $339 million. This also allows for expanding and targeting the audience along with increasing online brand visibility.
- Video ads allow in increasing the brand association by 139% and the conversion rate has also increased by 86%. This has also enhanced the shopping process almost 80% of people planned to purchase.
- For programming digital display advertisement advertiser has spent over $50 million in 2022. These ads have also increased audience engagement.
- Influencer advertisement is an effective segment of targeted advertisement accepted by 81% of marketers. Influencer ad recommendations were trusted by 92% of people which retains 37% better customer retention.
- Social media advertisement was practiced by 87% of marketers in 2022 and by 2024 it is expected to reach $79.28 billion.
Effectiveness of Targeted Advertising
- Over random and traditional advertisements the targeted were preferred by 40.5% of people.
- In the United States, 13% of people still didn’t share any personal details for marketing purposes with companies.
- Targeted ads give exact content that customers care about along with keeping the overall process interesting.
- Targeted ads containing customers' name becomes twice more likely.
- As of 2022, the targeted ads was having 800% increased brand search.
- Due to these ads, the Click-Through-Rates (CTR) have also increased by 11%.
- 90% of customers have agreed that video ads have helped them in making purchasing decisions.
General Targeted Advertising Statistics
- By the end of 2022, mobile ad spending has reached $327 billion as people were spending more time over the phone which allowed apps for gathering users’ information.
- In the United States in 2022, the largest share of targeted advertisements were Google Ads = 38.6% and Facebook Ads = 19.9%, Instagram Ads = 7.5%
- As of 2023, the Instagram ads platform is expected to share with Facebook because the Instagram advertising reach has increased by 100 million users.
- As of reports, targeted mobile ads are less annoying than other mobile ads accepted by 36% of people.
- The largest social media ads market in the world is the United States and the nation has invested $24.35 billion on ad spending.
- In America 2022, the mobile advertising market has grown by 13.7% from last year and is expected to grow by 16.9% by September 2023.
- Mobile ads in the 1st quarter of 2022 captured 80% of people's attention for 6.6 seconds and 50% watched for 3.2 seconds.
Market Size Statistics of Global Online Targeted Advertisement
- In 2022 the market size was $209.9 billion across the world and it is expected to reach 10.71% of CAGR by 2028 resulting in $389 billion.
- This kind of advertisement helps in promoting ads for different products and services by collecting data from several potential groups.
- The targeted ads are mostly used in some selected sections such as healthcare, retail, education consumer packaged food, automotive, media, and entertainment.
Targeted Advertising Statistics That Marketers Post vs. Consumers' Wants
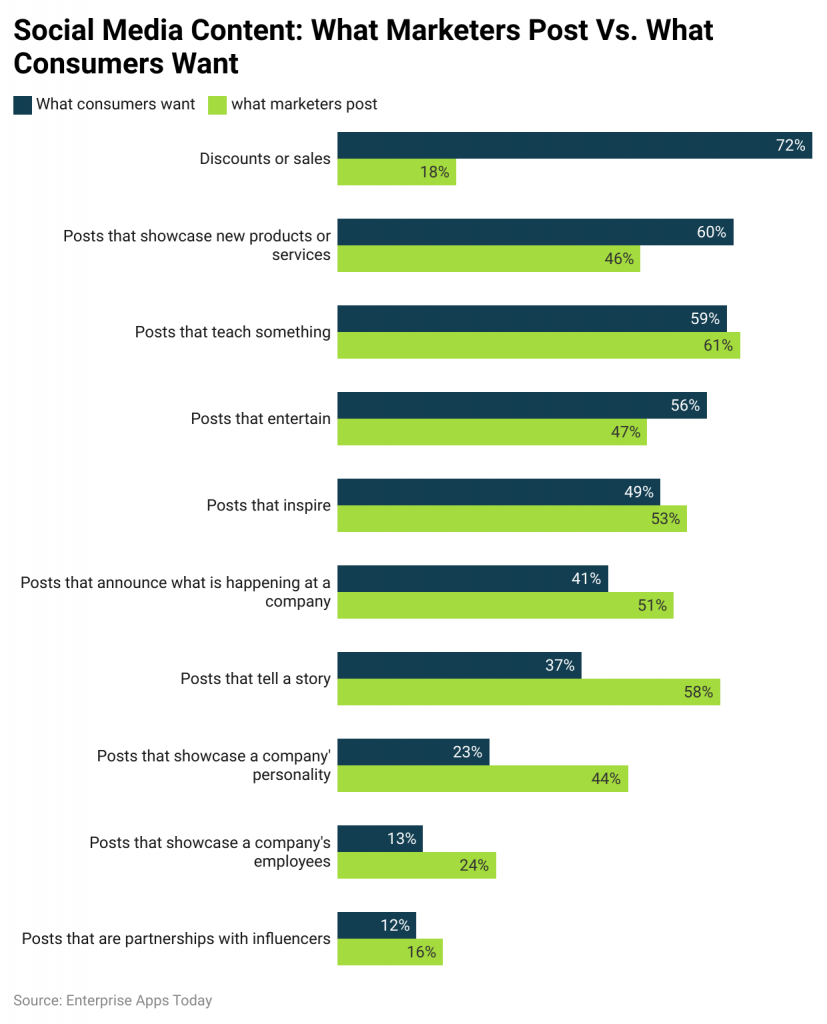 (Reference: wordstream.com)
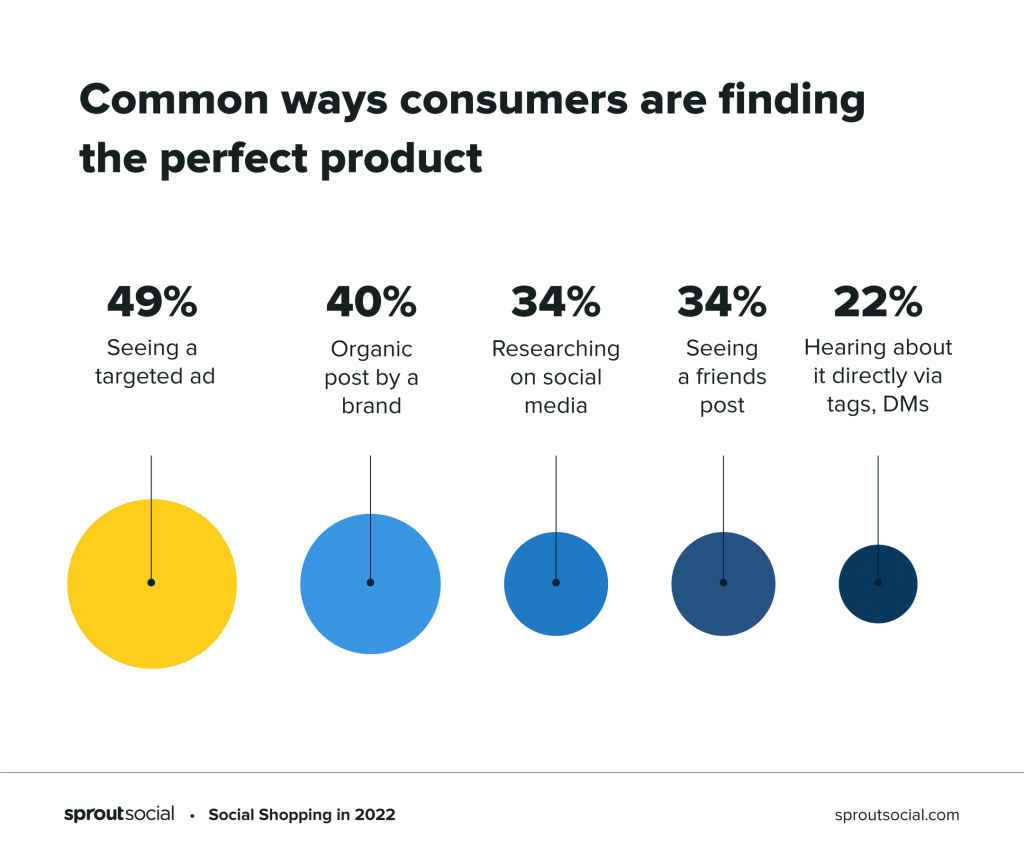
(Source: edia.sproutsocial.com)
- The above image depicts the ways that influence customers for finding out products of their choice.
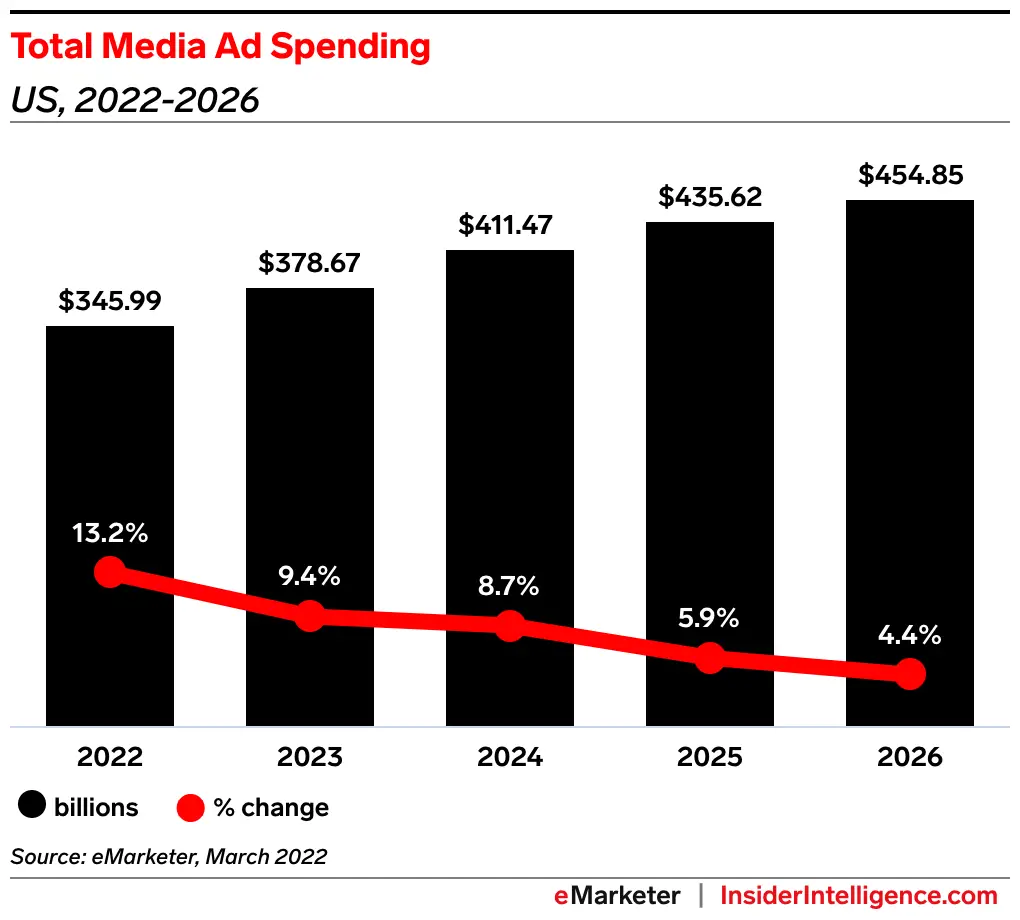 (Source: insiderintelligence.com)
- The above graph describes the stats of total media advertisement spending in the United States.
Targeted Advertisement Statistics By Challenges
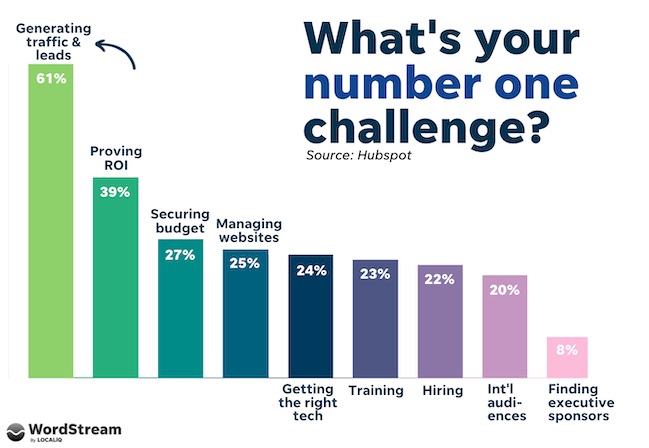
(Source: wordstream.com)
Targeted Advertising Infographical Presentation
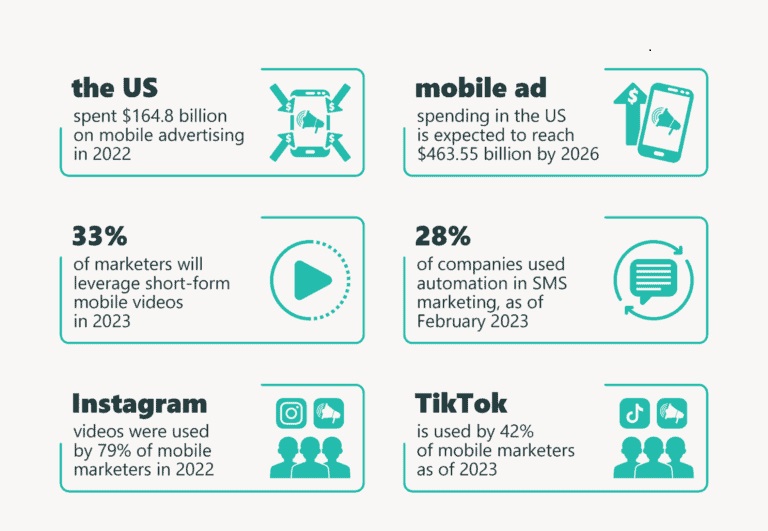
(Source: vpnalert.com)
- The above graph describing the spending of social media video ads in 2022 resulted in $24.35 billion an increase of 20.1% from the previous year.
Targeted Advertising Statistics by Platforms
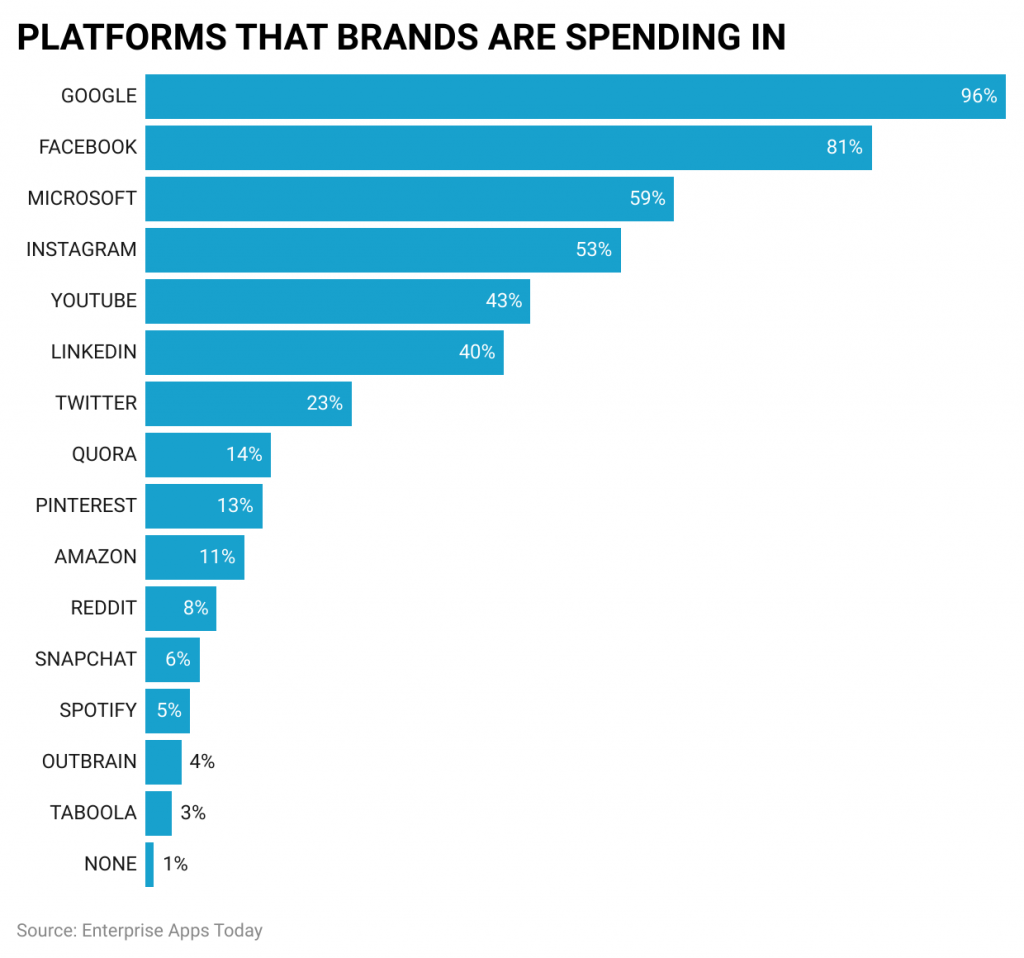
(Source: passivesecrets.com)
Data Sharing Statistics for Making Targeted Advertisement
- Email Address: 62% of consumers in the U.S. are okay with sharing their email addresses. This means most people don't mind companies having their email, probably for sending promotions or newsletters.
- Basic Information: 48% willingly share basic details about themselves. This could be things like their name, age, or gender. Almost half the consumers are comfortable letting companies know this general info.
- Shopping Details: 33% provide details about their shopping habits or products they buy. So, about a third of people let advertisers know what they shop for, helping companies tailor ads just for them.
- Phone Number: Only 21% share their phone number. This is lower because people might be wary of getting unsolicited calls or texts.
- Social Media Profile: Just 12% are okay with sharing their social media profiles. This suggests that a majority prefer to keep their online social life private from advertisers.
Purchase Statistics Based On Online Ads
- 1 – 25 times: 37.9% of people have been influenced to buy something after seeing online ads between 1 to 25 times. This means that for many people, it doesn't take too many ad views before they decide to buy something.
- 26 – 50 times: 23.7% of customers made a purchase after seeing ads between 26 to 50 times. So, roughly a quarter of people need to see an ad many more times before they're convinced to buy.
- 51 – 75 times: Only 13.6% of shoppers bought a product after viewing its advertisement 51 to 75 times. Fewer people fall in this category, suggesting that if someone hasn't purchased by this point, they're less likely to in the future.
- 76 – 100 times: A mere 4.5% made a buying decision after seeing an online ad between 76 to 100 times. This is a small group of people who might need a lot of persuasion or are just not that influenced by ads.
- Never got targeted: Surprisingly, 20.3% of customers say they've never been targeted by online advertisements. This could mean these folks use ad blockers, don't spend much time online, or somehow avoid the common online ad experience.
Targeted Advertising Statistics by Text
- Generation X: 49% of Generation X in America liked text advertisements for learning about brands. This means nearly half of this age group feels a connection to brands through written ads.
- Millennials: 47% of Millennials preferred text ads when getting to know brands. They're almost as likely as Generation X to be influenced by text advertising.
- Generation Z: 44% of Generation Z showed a preference for text advertisements. While they still have a significant preference for text, they're slightly less inclined compared to the older generations.
Targeted Mobile ad Spending Statistics by Countries
- United States: The U.S. led the pack by spending a massive $164.8 billion on mobile ads. This shows how big and influential the mobile advertising market is in America.
- China: China followed with $111.3 billion. Even though it's less than the U.S., it's still a huge amount, reflecting the vast number of mobile users in China.
- UK: The United Kingdom spent $17.36 billion. While it's much less than the U.S. and China, it's still a significant investment, showing the importance of mobile ads in the UK.
- Japan: Japan invested $11.19 billion in mobile advertising. As a tech-forward nation, it's evident they value reaching their consumers on mobile devices.
- Canada: Canada's spending stood at $7.27 billion. Given the country's smaller population compared to giants like the U.S. and China, this is a noteworthy amount.
- Germany: Germany dedicated $6.89 billion to mobile ads. This shows that even in Europe's largest economy, mobile advertising plays a big role.
- Australia: Down under, Australia spent $6.04 billion. For a continent with a smaller population, this is a significant commitment to mobile advertising.
- France: France allocated $4.45 billion for mobile ads. This indicates that even in a culture-rich country like France, modern mobile advertising has its place.
Targeted Advertisement Statistics by Making Purchasing Decisions
- Online Banner Ads: 39% of people decide to buy something after seeing online banners. This means these kinds of ads still have a decent impact on customers' decisions.
- Mobile Phone Ads: Also at 39%, mobile ads show they're as effective as online banners in influencing buyers. It proves the significance of advertising on mobile platforms.
- Sponsored Posts on Blogs: 43% of consumers make a purchase after reading sponsored content on blogs. This is higher than some might think and showcases the power of influencer and content marketing.
- Online Pop-ups: These are less influential, with only 25% being swayed to purchase. It seems people might find pop-ups more interruptive or less trustworthy.
- Ads Received on Emails: A whopping 76% make buying decisions based on email ads. This means email marketing remains a dominant force in advertising, with three out of every four people being influenced.
- Search Engine Ads: 61% are influenced by ads they see when they search online. These targeted ads, appearing when people are already looking for something, prove to be highly effective.
- Social Media Ads: Equal to blog posts, 43% decide to buy after seeing ads on their social feeds. Given how much time people spend on social platforms, this shows these ads are doing their job.
- Video Ads during Online Videos: Almost half, 47%, are influenced to buy after watching video ads. As online video consumption grows, these kinds of ads become increasingly pivotal.
Social Media Ad Revenue Growth Statistics by Companies
In 2022, social media ads were primarily aimed at the American audience. Here's how various platforms fared in terms of revenue growth from these ads:
- TikTok: Experienced a massive growth of 139.9%. This means TikTok's advertising business almost doubled, making it the fastest-growing platform on the list.
- LinkedIn: Saw a growth of 19%. As a professional networking site, this growth indicates more businesses are using LinkedIn for their advertising campaigns.
- Reddit: Enjoyed a growth of 16.6%. The community-driven platform is becoming a popular place for advertisers.
- Snapchat: Grew by 14.8%. Snapchat continues to appeal to its user base with its unique advertising strategies.
- Twitter: Experienced an 8.4% increase. Despite being one of the older platforms, Twitter still shows positive growth in its ad revenues.
- Pinterest: Had a modest growth of 3.3%. It remains a niche platform for specific advertising needs.
- Instagram: Just saw a growth of 1.5%. Given its massive user base, this is a very minimal growth and indicates saturation or competition affecting it.
- Meta: Faced a decline of 3.7%. This is surprising given Meta's (previously known as Facebook) dominance in the social media landscape.
- Facebook: Experienced a more significant drop of 8.5%. This suggests advertisers might be moving to newer platforms or are not seeing as much ROI on Facebook.
- Others: Various other platforms together showed a slight growth of 1.2%, indicating that there's always room for new players and innovations in the advertising domain.
TikTok ad Statistics
- The highest potential market reach of TikTok ads was in the United States = 109 million people, Brazil = 76+ million, and Indonesia = 69+ million.
- In 2022 the ad reach of TikTok has increased by 14.6% from last year resulting in 121 million.
- The majority of TikTok ads audience belongs to 18 – 34 years in female = 36.9% and male = 32.8%. Above 35 years audience = 30.4% and above 55 years = 5.5%.
- In 2022, TikTok ads that include #tiktokmademebuyit was having 31.8 million views
Facebook ad Statistics
- In 2022-23 the potential reach of Facebook advertising was 2.08 billion people.
- In 2022 the net ad revenue of Facebook was $$69.42 billion and is expected to be $71.32 billion.
- 62.6% of American people are the potential reach of Facebook ads are of above 13 years and 12.5 % of Americans was above 55 years.
- As of 2023, the potential audience of Facebook ads is 495.7 million users in which Southeast Asia = 18.7% and Southern America = 12.1%.
- Male audience of Facebook ad = 56.4%, female = 43.6%
- Click-to-Messaging format of ads was used by 40% of advertisers.
- In the 3rd quarter of 2022, there was a decrease of 18% in price per advertisement.
Instagram ad Statistics
- In 2022 the ad revenue of Instagram was $43.28 billion and in 2023 it is expected to increase by 12.1% resulting in $50.58 billion.
- In 2022, the audience of Instagram advertisements aged between 25 -34 years: female = 13.9% and male = 16.5% was the highest.
- Only 7% of the overall Instagram advertising audience = is above 55 years
- In 2022, Instagram ad penetration rate by region; The U.S. = 51.45, The UK = 51.9%, and Canada = 49.4%.
Twitter ad Statistics
- In 2022 the net ad revenue of Twitter = $6 billion.
- 6.8% of the global population was the potential reach of Twitter ads = $544.5 million.
- In 2022, Twitter ad reach has increased by 12%.
- Only 10.7% of overall internet users were Twitter’s ad reach.
- Male ad audience = 74.3% and female = 25.7%
- In 2022,region reach rate of Twitter ads Singapore = 65.1%, Japan = 60% and Saudi Arabia = 55.5%
- In the United States Twitter ads reach = 91.7 million people in 2022
LinkedIn ad Statistics
- The potential ad reach of LinkedIn ads reach = 857.1 million people.
- The LinkedIn ad reach has grown slowly in 2022 with a growth rate of 0.9% on each quarter.
- 10.7% of the global population was the potential reach of LinkedIn ads = 8571 million.
- Only 16.9% of overall internet users were the LinkedIn ad reach.
- Most LinkedIn ad audience belongs to the age group of 25 – 34 years and only 2.9% of the audience is above 55 years.
- In 2022,region reach rate of LinkedIn ads in U.A.E = 80.6%, The U.S. =71.8% and Singapore = 70.2%
Snapchat ad Statistics
- The potential ad reach of Snapchat ads reach = 40.29 million people which is 7% of overall Snapchat users in 2022.
- 34% of people purchase products after watching Snapchat ads and send references to friends and family = 45% of users.
- The reach of Snapchat ads in 2022 = 50% of Smartphone users.
- The highest audience for Snapchat advertisements was India = 145 million and 2nd The United States = 107 million.
- Ads 5 – 6 seconds long resulted in better and 64% of ads were viewed with sound.
YouTube ad Statistics
- In 2022, the ad reach of YouTube advertisements has experienced a 9.8% of growth rate.
- Male audience of YouTube ad = 54.3% and female = 45.7%
- In the 3rd quarter of 2022, YouTube ad has earned more than $7 billion in revenue across the world.
- YouTube ads watched on mobile captured more audience attention by 84%.
- YouTube ads were mostly based on customer’s interests agreed by 59% of the ad audience.
- Ad audience above 45 years = 29%.
- The highest advertising audience on YouTube was India = with 467 million
Conclusion
As of today, after completing the article on Targeted Advertising Statistics it can be easily concluded that the advertising industry has adopted many dynamic changes after the pandemic for targeting people by identifying their appropriate preferences and interest. The most targeted advertising platforms were social media and mobile in which people across the world remained more connected which made it easier for advertiser to collect their preferences. This article includes many informative statistics that help you in getting a basic idea about the topic.
Sources

Barry is a lover of everything technology. Figuring out how the software works and creating content to shed more light on the value it offers users is his favorite pastime. When not evaluating apps or programs, he's busy trying out new healthy recipes, doing yoga, meditating, or taking nature walks with his little one.