
Online Review Statistics By Users, Age and Facts
Page Contents
- Introduction
- Editor’s Choice
- Impacts of Online Review
- Importance of Online Review
- Facts on Online Review
- General Online Review Statistics
- Statistics of Beauty Product Buyers by Generation
- Statistics of Footwear Customers
- Review Statistics
- Reasons for Customer Review
- Statistics by Numbers
- Reviewing Business Statistics
- Customers Reviews Statistics
- Conclusion
Introduction
Online Review Statistics: The reports say that people in the age group 18–34 years believe online reviews the most, almost 91%, and 93% of people get influenced by online reviews and make the decision to buy. An online review is a statement of opinion or feedback made by customers about any products, services, and other experiences that are posted online through different business websites and social media networks. This includes many positive and negative factors that may impact directly or indirectly on the business. These Online Review Statistics include many informative data and charts that will help in better understanding the topic and its current importance over the nation.
Editor’s Choice
- Before making a purchase, 95% of customers go through online product reviews in 2022.
- In the U.S. 89% of consumers try to read reviews before making an online purchase.
- Consumers trust internet reviews more than personal advice in 49% of cases.
- In 2022, a review helped 94% of U.S. people to stay away from several business losses.
- 97% of local business feedback has been read.
- If the online site doesn’t have more reviews or feedback then 68% of people won't believe a 5-star rating.
- As of 2023, on average, the reviews increased purchases by 18%.
- Keeping aside all other platform reviews, in 2022 81% of U.S. customers first preferred Google reviews.
- 53% of customers had expected brand responses to bad reviews within a week.
- In response to negative reviews, 75% of U.S. companies remained silent.
- Consumers say reviews boost their trust in a business 74% of the time.
Impacts of Online Review
- Online reviews and conversion rates are directly related in every business platform and conversions can increase by 10% as a result of one review.
- This helps in enhancing the decision of buying products and services by 67.7%.
- Consumer review websites are visited by 82% of U.S. customers who are ready to purchase in 2022.
- Sales rates were boosted by 6.46% as a result of product and company reviews shared on Twitter.
- When a product has satisfactory reviews almost 81% of consumers prefer to wait longer to get delivered.
- For products and services those are having more than 5 reviews in such cases customer’s preference increases by 4 times.
- As of 2022, the review system has influenced more than 98% of software buyers in the United States.
Importance of Online Review
- Online reviews are the main source of social proof that significantly impacted business sales along with driving up overall revenue.
- Reviews on online websites and social media make more visible about the products and services as customers value unique and recent material as well as user feedback when presenting the information.
- Companies those are having better online reviews results in better sales profitability.
- This review system also enhances the power of customers’ purchasing decisions.
- This process also helps in building brand trust in the minds of potential customers.
- Online reviews are a great opportunity to address several problems of every customer along with enhancing different processes within the business.
Facts on Online Review
- Over 3-month-old reviews are meaningless, according to 85% of consumers.
- Before deciding to trust a company, customers read an average of 10 reviews.
- As of 2022, only 6% of customers completely ignore customer reviews.
- In the U.S. 89% of shoppers try to read reviews before making an online purchase.
- More than 50% of youngsters claimed that they always check customer reviews of brands.
- 89% of American customers use Smartphones to check online reviews.
- 88% of U.S. CEOs assumed that online reviews can put a company's reputation in danger.
- Unsatisfactory user experiences accounted for 86% of customers who had a chance of exiting the business.
- Consumers specifically looked for negative reviews in 82% of cases in 2022.
- Online customer reviews are read by 90% of women and 88% of men.
- Each month, almost 47% of customers submit their purchasing feedback.
General Online Review Statistics
- Before making a purchase, 17% of American online consumers always read product reviews.
- The “very important” factor in decision-making has been stated by 38% of American customers in 2022.
- 25% of U.S. people believe that customer product reviews are significant when selecting from online platforms.
- As of 2022, according to Statista, the “very helpful” factor was suggested by 62% of customers.
- Internet users in the United States used online reviews, in which 49% claimed to have checked Facebook for different local businesses.
- As of 2022, Americans claim to spread negative experiences more often than positive ones.
- On average the U.S. brand received around a 5-9% revenue boost for each star they get on Yelp.
- In 2022, before making any kind of purchase U.S. consumers have consulted over more than 10 sources of information.
- The top four online review sites covered 88% which includes Google, Facebook, Yelp, and Trip Advisor.
- Google reviews have increased foot traffic toward local businesses in the U.S. by the end of 2022.
- 263 million people which is approx 80% of U.S. customers preferred online shopping and by 2025 it is estimated to reach 291.2 million.
- As of 2022, retail sales have increased by 6.9% and are expected to be 8% in 2023 because of online reviews.
- Consumers in the U.S. claimed that social media posts from family members and friends have influenced their purchasing choices by 71%.
- This market was estimated to be to increase at a CAGR of 26.19% from 2022 to 2030.
- In 2022, there were 3,161.64 billion monthly visitors to Amazon's website.
- It has been observed that around 28% of people in the U.S. review feedback till the moment before purchasing from any store.
- The most downloaded shopping app in the US was Amazon, which boasted approximately 35 million downloads by the end of 2022.
(Reference: statista.com)
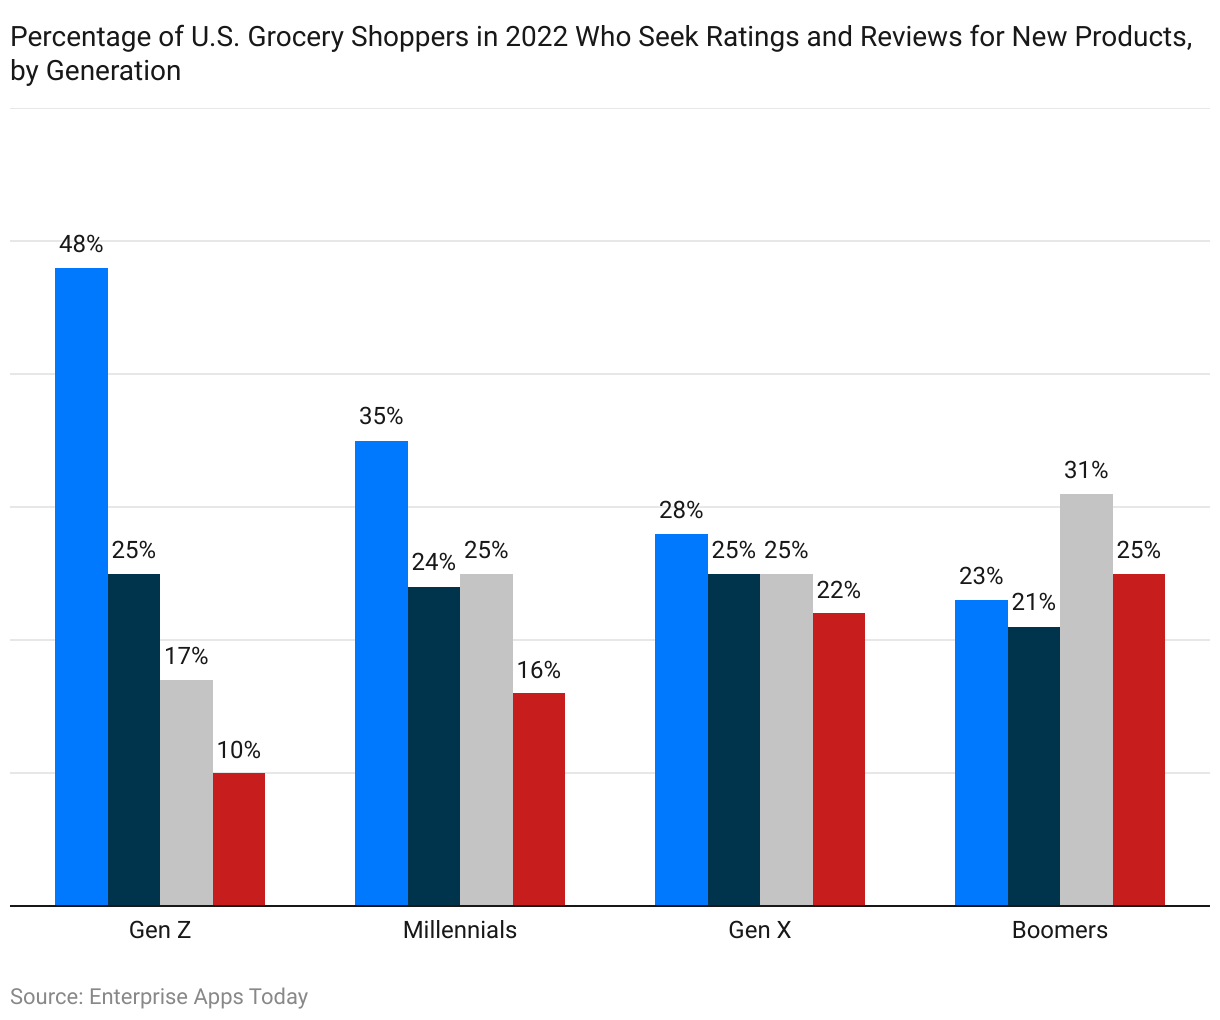
The above graph presentation describes the percentage of American grocery store customers who looked at ratings and online reviews in 2022 when purchasing a new grocery item, stated by generation.
- Gen Z (age group = 6-23 years): 48% very interested, 25% interested, 17% somewhat interested, and 10% not interested.
- Millennial (24-40 years): 35% very interested, 24% interested, 25% somewhat interested, and 16% not interested.
- Gen X (41-56 years): 28% very interested, 25% interested, 25% somewhat interested, and 22% not interested.
- Boomers (57-75 years): 23% very interested, 21% interested, 31% somewhat interested, and 25% not interested.
(Reference: ojdigitalsolutions.com)
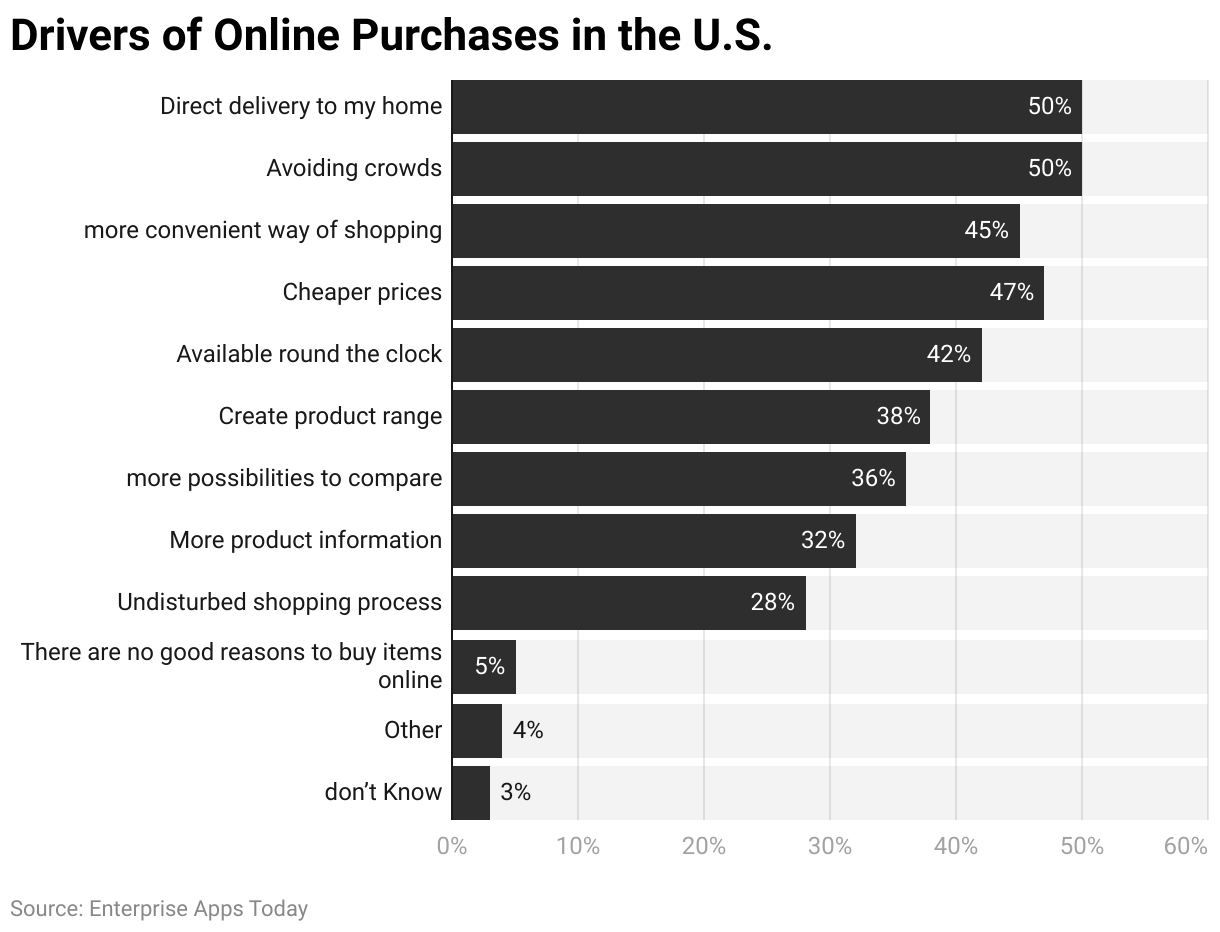
The above graph depicts the drivers of online purchases in the U.S. that are influenced by the online review system in 2022.
- Direct delivery = 50%
- Avoiding crowds = 50%
- A more convenient way of shopping = 48%
- Cheaper expenses = 47%
- Available on time = 42%
- Creator product range = 38%
- More possibilities to compare = 36%
- More product information = 32%
- Undisturbed shopping process = 28%
- No good reason to buy online = 5%’
(Reference: 99firms)
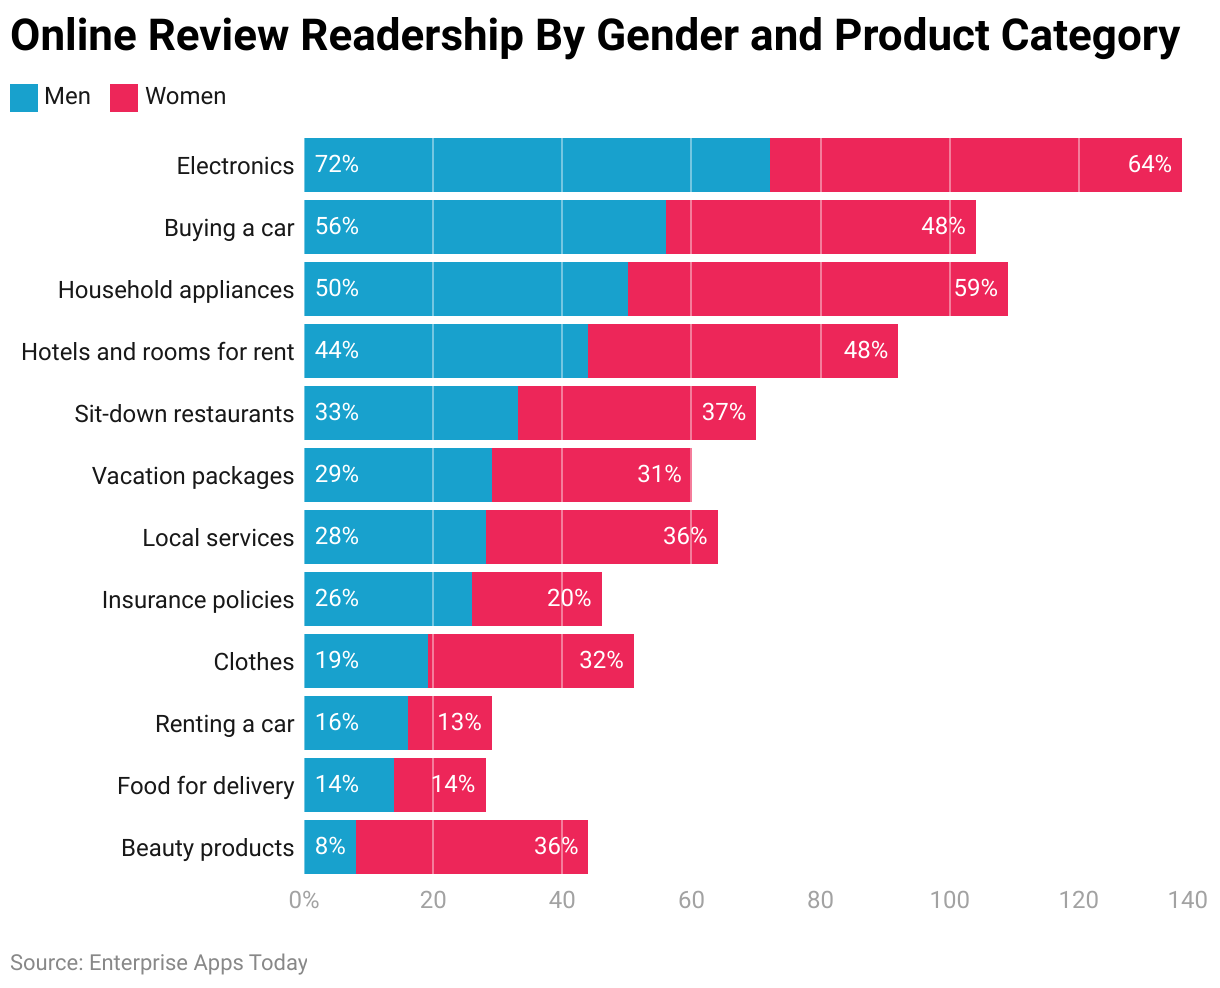
- The graph shows the online review stats of males and females in 2022.
- Most men rank highest on electronics (64%), buying cars (48%), renting cars (13%), and insurance policies (20%).
- When purchasing cosmetics (36%), clothing (32%), or household appliances (59%), women are more inclined to check online product reviews.
(Reference: truelist.co)
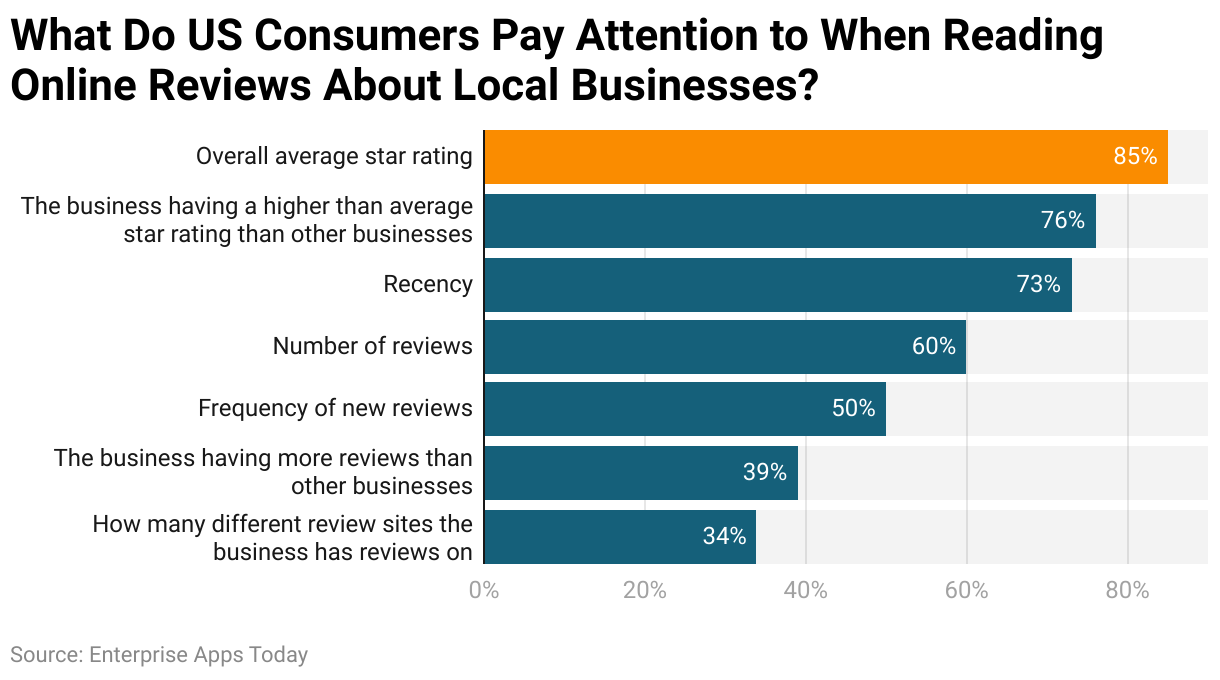
- The above graph describes on what basis U.S. people go through online reviews about local businesses.
- 85% of customers judge based on the overall average star rating.
- 76% of customers find that the business is having higher star rating than other businesses.
- 73% depends on regency and 60% of customers make decisions on several reviews.
- 50% of customers follow up on new reviews.
- 39% compare reviews with other businesses
- 34% review different business sites.
Statistics of Beauty Product Buyers by Generation
- As of 2022, around 76% of Gen Z purchased online cosmetic products only after frequently reading out all online reviews and ratings in the U.S.
- 47% of Gen X had never gone through online ratings and reviews before making any purchase by the end of August 2022.
Statistics of Footwear Customers
- In a survey conducted in 2022, almost 41% of Americans said they always check for visual content posted by users and their feedback before purchasing shoes online.
- 28% of U.S. customers said they didn’t go regularly through such reviews before buying in 2022.
- Only 5% of customers never trusted online reviews.
Review Statistics
- The majority of U.S. customers around 26.6% think that a business rating needs to have an average of 50 reviews to be reputable so that people feel confident before buying.
- Minimum 50-100 reviews = 18.9%
- Maximum 500 reviews = 14.1%
- Above 500 reviews = 5%
- Only 1-10 reviews = 22%
Platforms Used for U.S. Online Review
- In Google business profile, the average monthly traffic = 158.03 million
- Facebook = 85.57million
- Amazon = 85.44 million
- Yelp = 40.47 million
- Trip advisor =28.27 million
- Yellow pages = 10.5 million
- Manta = 6.48 million
- Better Business Bureau = 6.15 million
- Agni = 5.44 million
- Foursquare = 3.67 million
Statistics Sector-wise
- In 2022, the top businesses in the U.S. with positive reviews are consumer goods and services = 94%, the finance sector = 94%, healthcare sector = 92%.
- Industries holds most negative reviews are transportation = 28%, Property management = 22%, hospitality = 16%.
Reasons for Customer Review
- 55% intention was to help other buyers.
- 42% wanted to grab attention from the business.
- 34% wrote reviews to help the business.
- 13% on the request of employees as it offers incentives.
- 11% shared negative to harass the business.
Statistics by Numbers
- Reviews read out before making any purchase mostly was (1-3) reviews = 36.4% of customers
- 4-6 reviews = 31%
- 7-9 reviews = 9.1%
- More than 10 reviews = 14.6%
- No review required = 8.7%
Reviewing Business Statistics
- Most U.S. companies ask their customers to share reviews through different segments after making purchasing.
- Email =50%
- Social media = 32%
- Asked in stores = 22%
- Cell phone = 22%
- SMS = 14%
- Chatbot =8%
- Printed materials = 11%
Customers Reviews Statistics
- Within the day of purchasing = 14% share their review as soon as possible.
- After 1-2 days = 17%
- 3rd day after purchasing = 17%
- Within one week = 24%
- On 2nd week = 7%
- On 3rd week = 5%
- On 4th week = 4%
- After 1 month = 2%
- No exact time = 4%
- Never review = 7%
Conclusion
As of today online reviews on the internet help consumers to shop online, and consumers are becoming increasingly dependent on reviewing several feedbacks to assess the quality of different products and services before making any purchasing decisions. Online review statistics have flourished in the overall business sector and thus it can be predicted that the review system by enhancing the market more in the coming years as well. In 2022, reviews helped 94% of U.S. people to stay away from several business losses and around 89% of consumers try to read reviews before making an online purchase.
Sources
FAQ.
On the Internet and online shopping platforms, customer reviews are a type of feedback from customers.
Almost 95% of people prefer online reviews also can be said 9 out of 10 customers go through a process before shopping.
Online reviews reportedly influenced consumers' purchasing decisions that have been seen in 93% of people.
Company brands with online reviews are 63% more likely to be trusted than brands without reviews.

Barry is a lover of everything technology. Figuring out how the software works and creating content to shed more light on the value it offers users is his favorite pastime. When not evaluating apps or programs, he's busy trying out new healthy recipes, doing yoga, meditating, or taking nature walks with his little one.