
Dunkin Statistics 2024 By Revenue, Donuts Sales, Location, Order Accuracy, Speed of Service, Employee and Facts
Page Contents
- Introduction
- Editor’s Choice
- Dunkin' Facts
- General Dunkin Statistics
- Dunkin' vs Starbucks Statistics
- By Initial Franchise Investment in the US
- By Locations
- By Satisfaction Level of Service Received
- By Order Accuracy
- By Average Total Time Per Chain by Vehicles in Line
- By Dunkin's Drive-Thru Performance
- Dunkin Statistics by Speed of Service
- By Employee Demographics
- American Customer Satisfaction Index Score by Restaurant Brand
- By Order Confirmation Boards
- By Online Business
- By Calorie Count
- Conclusion
Introduction
Dunkin Statistics: Dunkin', established in 1950, has evolved into the premier coffee and donut brand in the United States, boasting over 13,200 outlets across nearly 40 global markets. As a subsidiary under the Inspire Brands umbrella, Dunkin' maintains a strong presence in the food and beverage sector, particularly known for its diverse range of products including donuts, bagels, muffins, iced coffee, and sandwiches. The company has demonstrated significant financial health, with a reported revenue of $1.4 billion in FY 2019, highlighting its status as a major player in the quick service restaurant (QSR) industry. With its headquarters in Canton, MA, Dunkin' continues to innovate and expand, serving millions of customers daily and holding a competitive edge against rivals such as McDonald's, Starbucks, and Chick-fil-A. This robust performance can be attributed to Dunkin's established brand strength, flexible restaurant designs, exceptional support system, and strategic franchise advantages, which collectively contribute to its ongoing success and expansion in the competitive marketplace.
Editor’s Choice
- Coffee Quality Assurance: Dunkin' ensures the quality of their coffee through a rigorous tasting process, with their team tasting anywhere from 100 cups a week to 200 cups per day. This system evaluates coffee on several quality parameters including acidity, aroma, and balance.
- Global Presence: As of 2021, Dunkin' operates 12,700 stores across 40 countries, underscoring its position as a global leader in the coffee and donut industry.
- Revenue from Coffee Sales: In 2016, coffee and coffee-related beverages accounted for 60% of Dunkin's revenue, highlighting the significance of coffee to their business model.
- Annual Coffee Sales: Dunkin' reported selling 2 billion cups of coffee worldwide in 2017, which translates to approximately 60 cups of coffee every second.
- Brand Recognition: In the 2021 Harris Poll, Dunkin' and Starbucks were tied as the brand of the year in the coffee shop category, reflecting Dunkin's strong brand equity.
- Financial Performance: In 2019, Dunkin' Donuts generated $1.37 billion in revenue worldwide, indicating steady growth over the years.
- Donut Sales: Dunkin' sells 2.9 billion donuts per year, including munchkins, demonstrating its continued dominance in the donut market.
- Single-Serve Coffee Revenue: In 2019, Dunkin' generated $3.69 million in revenue from the sale of K-cups or single-serve coffee, a 10.8% increase from the previous year.
- Ground Coffee Revenue: Also in 2019, Dunkin' generated $3.15 million in revenue from the sale of ground coffee, marking a 5.6% increase from the previous year.
- Workforce: Dunkin' employs more than 250,000 team and franchise members, contributing significantly to employment in the regions it operates.
You May Also Like To Read
- McDonald’s Statistics
- Online Food Ordering Statistics
- Soft Drink Sales Statistics
- Pizza Hut Statistics
- Starbucks Statistics
Dunkin' Facts
- Dunkin' offers a great variety of shots, sweeters, syrups, coffees, munchkins, and much more.
- This brand once sold a cup of coffee for only 10 cents, while the cost of the donut was 5 cents.
- The quick-selling item Cronus which is a combination of donut and croissant, was supposed to be a temporary product.
- Surprisingly, more coffee is sold as compared to donuts in Dunkin.
- In 2023, Dunkin reduced 10% of their menu items.
- People can get married at Dunkin’.
- Dunkin' also has DIY Cold Brew Coffee Packs.
- Whatever is on the Dunkin’ menu can be customized.
General Dunkin Statistics
- Incredible Variety: Dunkin' boasts an astonishing 25,000 ways to order your coffee, underscoring their commitment to customization and customer choice.
- Unique Offerings Worldwide: Dunkin' adapts its menu to reflect local tastes across the globe, offering unique items like wasabi cheese and seaweed cheese donuts in Singapore and mochi donuts in some Asian countries.
- Donut Hole Treats: The inception of MUNCHKINS® donut hole treats in 1973 was a creative way to utilize the dough from the center of donuts. Today, approximately 1 billion MUNCHKINS® are sold globally each year.
- Coffee Over Donuts: Despite being famous for donuts, Dunkin' sells more coffee than donuts, highlighting its strength in the coffee market. This shift towards coffee was significantly boosted under the leadership of CEO Jon Luther in the early 2000s, who refocused the brand's direction to emphasize coffee, leading to a revitalization of the company.
- Cronut Popularity: The croissant-doughnut mashup, inspired by the Cronut, was introduced in 2014 as a temporary item but became a permanent fixture due to its popularity, with 8.5 million sold in the first three months.
- Special Relationships: Dunkin' has a special connection with Boston, notably during the 2013 citywide lockdown following the Boston Marathon bombing, where Dunkin' stores remained open to serve the community, especially law enforcement officials.
- Marriage at Dunkin': A handful of couples have celebrated their love by getting married at Dunkin' Donuts locations, showcasing the brand's unique place in their hearts and lives.
- Coffee Experts: Dunkin's dedication to quality is evident in their coffee tasting process, where experts taste an average of 200 cups a day to ensure the highest quality for consumers.
- Most Famous Drink: The most preferred type of drink at Dunkin' is caramel swirl iced coffee in the USA.
- Per Day Serve: Across 33 countries, every day on average 5 million customers are served.
Dunkin' vs Starbucks Statistics
- Market Presence and Revenue: Starbucks leads with a global presence in twice as many countries as Dunkin', boasting around 20,000 retail stores worldwide. The revenue gap is substantial, with Starbucks generating nearly 20 times the global revenue of Dunkin', underscoring Starbucks' dominance in the market.
- Pricing Strategy: Dunkin' positions itself as a more cost-effective option, offering coffee and food items at lower prices than Starbucks. A large latte at Dunkin' is priced at $2.49, while a similar venti latte at Starbucks costs $4.15, highlighting the pricing differentiation strategy of both brands.
- Consumer Preferences: Surveys indicate a stronger preference for Starbucks among consumers, with 23% opting for Starbucks compared to 14% for Dunkin'. Additionally, Starbucks' coffee is preferred for its higher caffeine content, providing around 12% more caffeine than Dunkin's offerings.
- Product Favorites: Starbucks' Vanilla Sweet Cream Cold Brew and Iced Coffee are among the most favored iced drinks, while Dunkin's Caramel Swirl Iced Coffee is its top choice among consumers, reflecting the varied taste preferences of their respective customer bases.
- Digital and Loyalty Programs: Starbucks leads in digital sales growth and loyalty program membership, with 19.3 million active U.S. members as of 2020. Dunkin's DD Perks Rewards Program, however, has also shown impressive growth, reaching 13.6 million members in September 2020, demonstrating effective engagement strategies by both companies.
- Store Count and Growth: Starbucks has approximately 15,041 stores in the United States compared to Dunkin's 9,570 as of 2020, reflecting Starbucks' larger footprint in the domestic market. Both brands serve a significant number of coffee cups annually, with Dunkin' serving about 2 billion cups worldwide, indicating the vast scale of their operations and the global appeal of their coffee.
By Initial Franchise Investment in the US
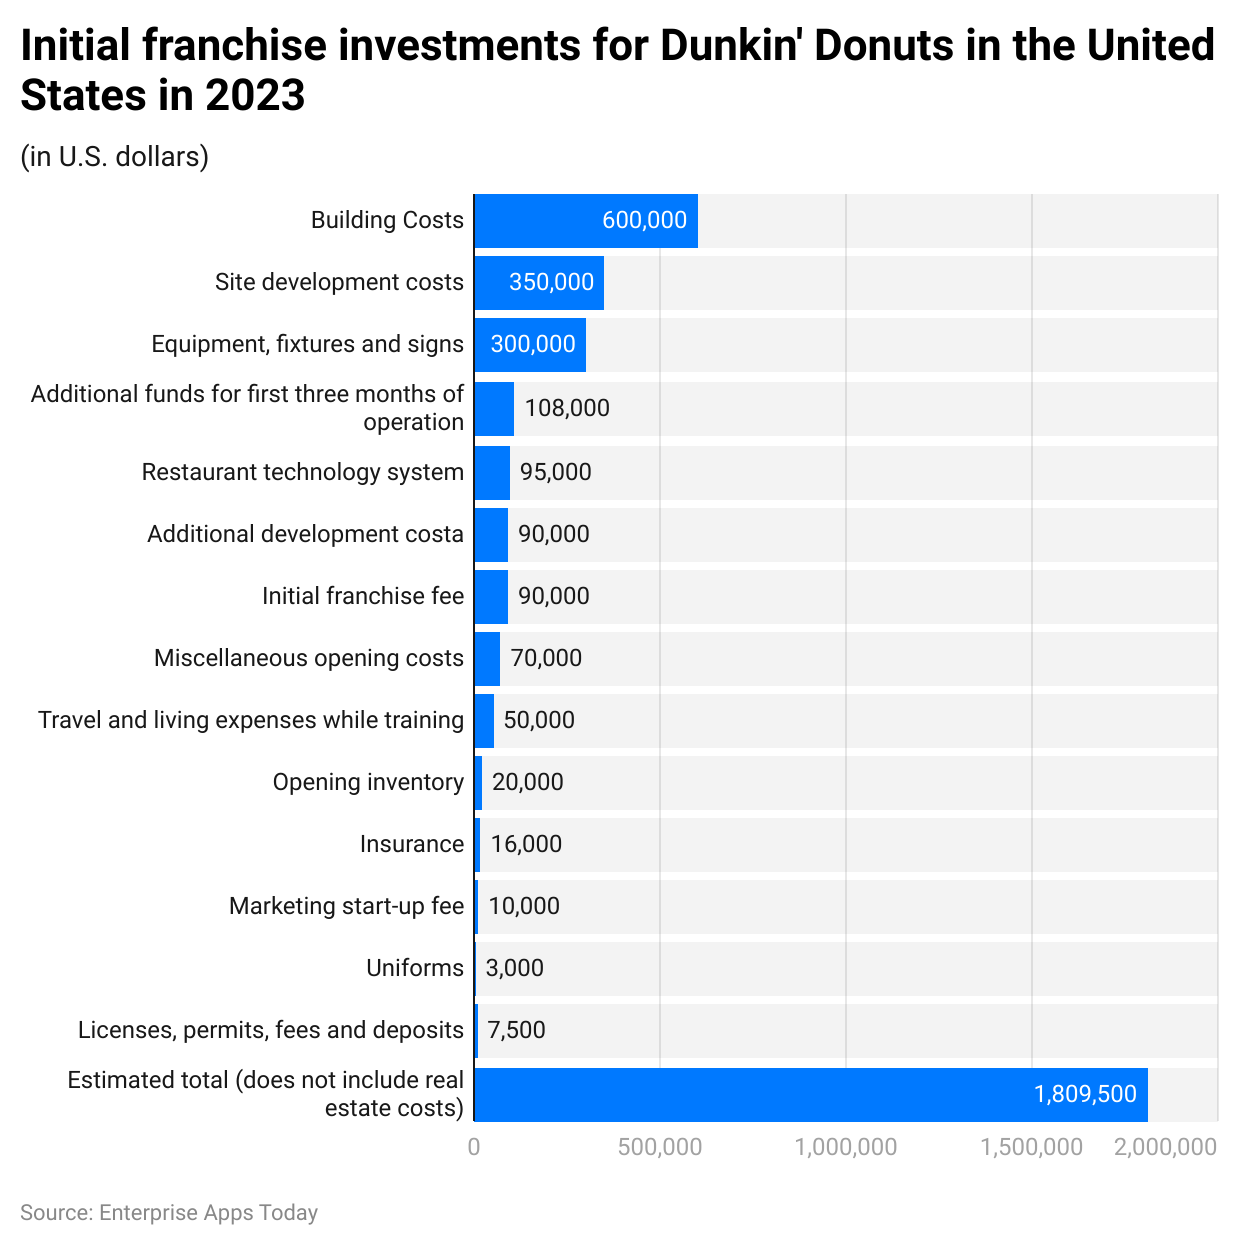
(Reference: statista.com)
In comparing the initial franchise investment requirements for Dunkin' with those of Starbucks, the 2023 data reveals that Dunkin' offers a range of investment levels depending on the type of restaurant format chosen by the franchisee. Here's a breakdown of the investment requirements for Dunkin' franchises in the U.S., based on the type of restaurant format:
- Freestanding Dunkin' Outlets: Require an investment ranging from approximately $526,900 to $1,809,500. This type of outlet typically incurs the highest initial investment due to factors like building and site development costs.
- Shopping Center/Storefront Locations: These require a slightly lower investment, ranging from about $437,500 to $1,310,500. The variation in cost is due to differences in site development and construction requirements compared to freestanding locations.
- Gas & Convenience: Represent the lower end of the investment spectrum for Dunkin', with required investments ranging from $210,900 to $1,038,100. These outlets are usually smaller and require less in terms of build-out costs.
- Non-traditional Outlets: These include locations in airports, hospitals, and universities, with investments ranging from $121,400 to $904,600, reflecting the diverse nature of these types of locations and their specific setup costs.
For a freestanding Dunkin' franchise, the initial investment covers a wide range of costs, including the initial franchise fee, building costs, and operating expenses. The initial franchise fee alone can range from $40,000 to $90,000, depending on various factors.
In terms of profitability and sales, Dunkin' franchises demonstrate strong performance across different types of outlets. For instance, freestanding drive-thru locations show average annual sales of around $1,290,494, while non-drive-thru freestanding locations have slightly lower average sales. The sales figures vary by location type, reflecting differences in customer access and service format. Dunkin' franchises are known for their solid EBITDA margins, indicative of their profitability in the quick-service restaurant industry
By Locations
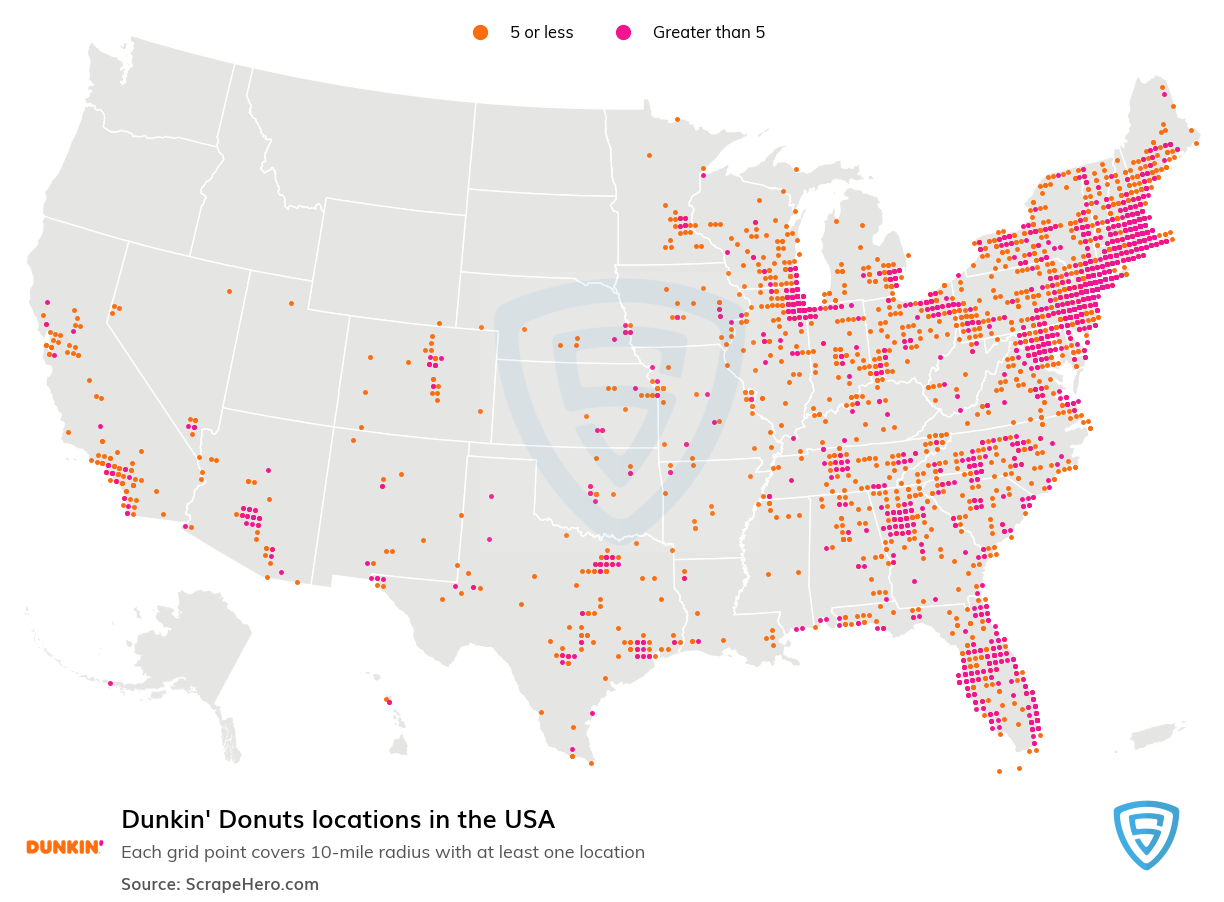
(Source: scrapehero.com)
As of January 2024, Dunkin' operates 28,776 locations across the United States, with the highest concentration of stores found in New York, accounting for 4,287 locations or roughly 15% of all Dunkin' outlets nationwide. Other states with significant numbers of Dunkin' locations include Massachusetts with 3,162 (11%) and Florida with 2,706 (9%). This expansive presence underscores Dunkin's dominant role in the American coffee and baked goods market.
By Satisfaction Level of Service Received
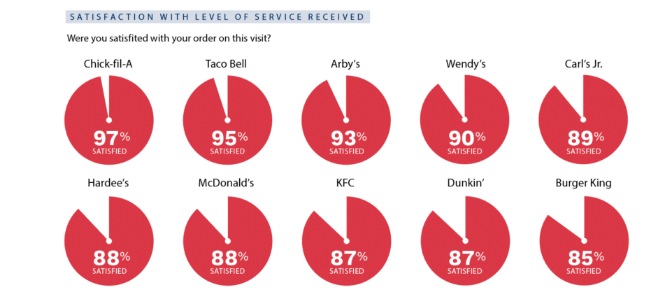
(Source: qsrmagazine.com)
Analyzing the landscape of quick-service restaurants (QSRs) in 2023, several key trends emerge, particularly in the realm of customer satisfaction and service efficiency. Dunkin', within this competitive arena, has maintained a strong presence, reflecting broader industry shifts towards digital integration and enhanced customer experiences.
The QSR Drive-Thru Report of 2023 underscores the significance of swift service and technological advancements in driving customer satisfaction. Brands that adeptly merged digital technologies into their drive-thru operations notably outperformed in service speed and customer satisfaction metrics. Specifically, the integration of AI and voice ordering systems has been pivotal in refining the drive-thru experience, a domain where Dunkin' competes fiercely.
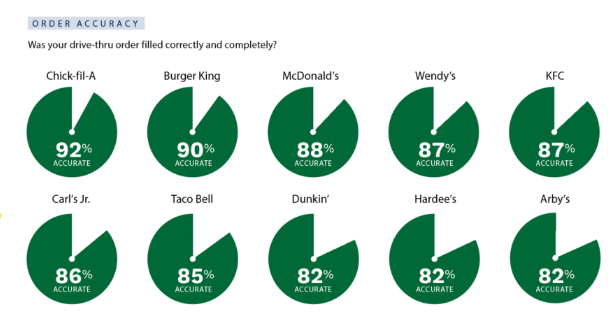
Dunkin' is among the top 10 brands recognized for high customer satisfaction levels, with an 87% satisfaction rate for the service received. This places Dunkin' in a commendable position, though behind industry leaders such as Chick-fil-A, which leads with a 97% satisfaction rate, followed by other notable brands like Taco Bell and Wendy’s.
Further insights from the Intouch Insight Drive-Thru Study of 2023 reveal a broad appreciation for friendly service, which significantly impacts overall customer satisfaction. This study found that orders taken with friendly service not only enjoyed an 84% higher satisfaction rating but also demonstrated 18% higher accuracy and faster service times by 34 seconds compared to those without.
The drive-thru sector's evolution, marked by a 30% increase in popularity during the pandemic, now accounts for over two-thirds of all fast food purchases. This shift underscores the strategic importance of drive-thrus in the current QSR landscape, with digital transformation playing a crucial role in maintaining the golden trio of service: speed, consistency, and accuracy.
AI-powered drive-thrus, highlighted as a leading trend for 2024, exemplify the industry's direction. These systems, by automating order taking and processing, not only mitigate labor shortages but also enhance service accuracy and speed. Leading QSR brands adopting voice AI technology have reported notable improvements in service efficiency, setting a benchmark for the sector.
By Order Accuracy
(Source: qsrmagazine.com)
In the 2023 Quick Service Restaurant (QSR) Drive-Thru Report, Dunkin' has once again demonstrated its commitment to order accuracy, achieving an impressive 82% rate. This places Dunkin' among the top brands for order accuracy in the fast-food industry, underscoring its ability to consistently meet customer expectations in this key operational area. Chick-fil-A led the rankings with the highest order accuracy rate of 92%, showcasing its industry-leading performance in ensuring orders are correct.
The significance of order accuracy in the fast-food sector cannot be overstated, as it directly impacts customer satisfaction and loyalty. Brands like Dunkin' and Chick-fil-A excel in this domain by effectively leveraging technology and operational strategies to minimize errors and enhance the overall customer experience. As the industry continues to evolve, the focus on accuracy, alongside speed and service quality, remains a critical factor for success in the competitive QSR landscape.
By Average Total Time Per Chain by Vehicles in Line
(Source: qsrmagazine.com)
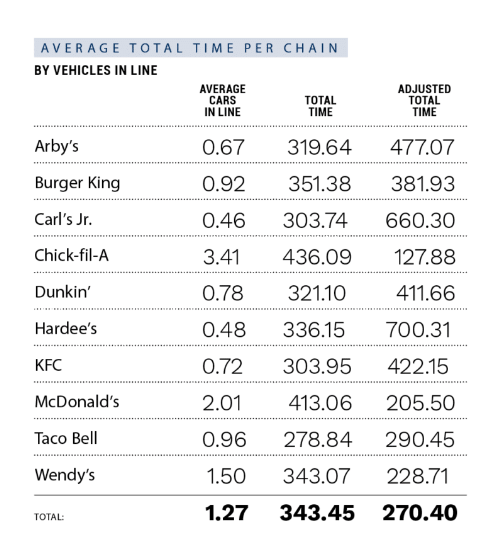
Dunkin Statistics states that the average total time taken is 321.10. Furthermore, the adjusted total time for the same is 411.66. The total number of average cars in line in 2023 was 0.78.
By Dunkin's Drive-Thru Performance
- Drive-Thru Wait Time: The average wait time for Dunkin's drive-thru, from the moment customers arrive to when they place their order, was approximately 24.24 seconds. This initial phase is crucial for a quick service experience.
- Service Time: Once an order is placed, the service time—spanning from order reception to delivery—averaged about 151.96 seconds. This metric is essential in assessing the efficiency of the drive-thru operation.
- Total Drive-Thru Time: Combining both the wait and service times, the total time a customer spent in Dunkin's drive-thru averaged around 176.20 seconds. This provides a comprehensive view of the customer's drive-thru experience from start to finish.
- Impact on Sales: Dunkin' locations equipped with a drive-thru witnessed a significant increase in sales volume—nearly 23% higher compared to those without a drive-thru. This statistic underscores the importance of drive-thru service in boosting overall store performance.
- Drive-Thru Availability: Approximately 59% of traditional Dunkin' locations feature a drive-thru, highlighting the company's commitment to providing convenient and quick service options to its customers.
- Focus on Speed and Quality: Despite the introduction of more complex menu items, Dunkin' prioritizes maintaining speed of service in the drive-thru without compromising on product quality. Training and operational strategies are deployed to ensure efficiency and customer satisfaction.
- Innovation in Ordering: Dunkin' has innovated its drive-thru service with the introduction of On-the-Go Ordering through its mobile app. This feature allows customers to place orders up to 24 hours in advance, enhancing convenience and reducing wait times at the drive-thru.
Dunkin Statistics by Speed of Service
(Source: qsrmagazine.com)
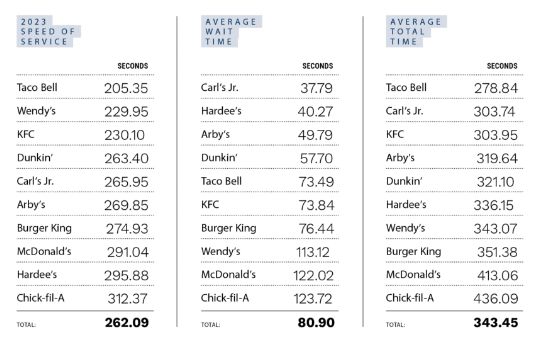
According to the QSR drive-thru report, it takes 263.40 seconds for Dunkin to complete an order. The average waiting time is 57.70 as shown by Dunkin Statistics. However, the fastest quick service brand by speed of service was Taco Bell resulting in 205.35 seconds.
By Employee Demographics
By Gender
(Reference: zippia.com)
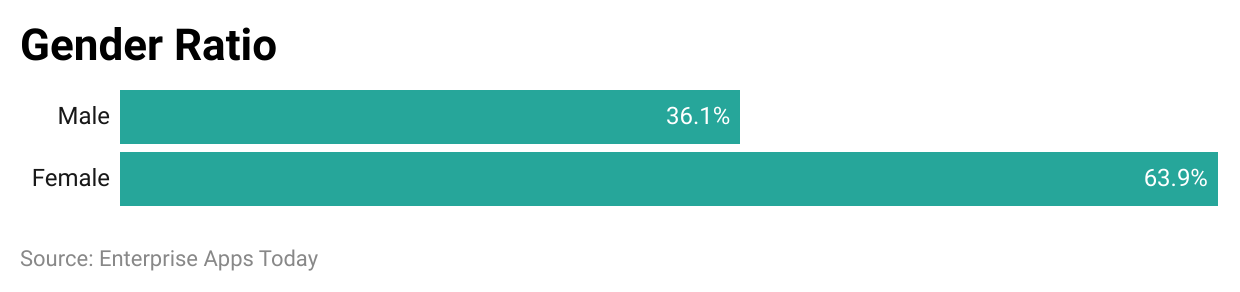
Dunkin' demonstrates a gender-diverse workforce, with a significant female majority.
- Female employees constitute 63.9% of the workforce.
- Male employees make up 36.1% of the workforce.
By Ethnicity
(Reference: zippia.com)
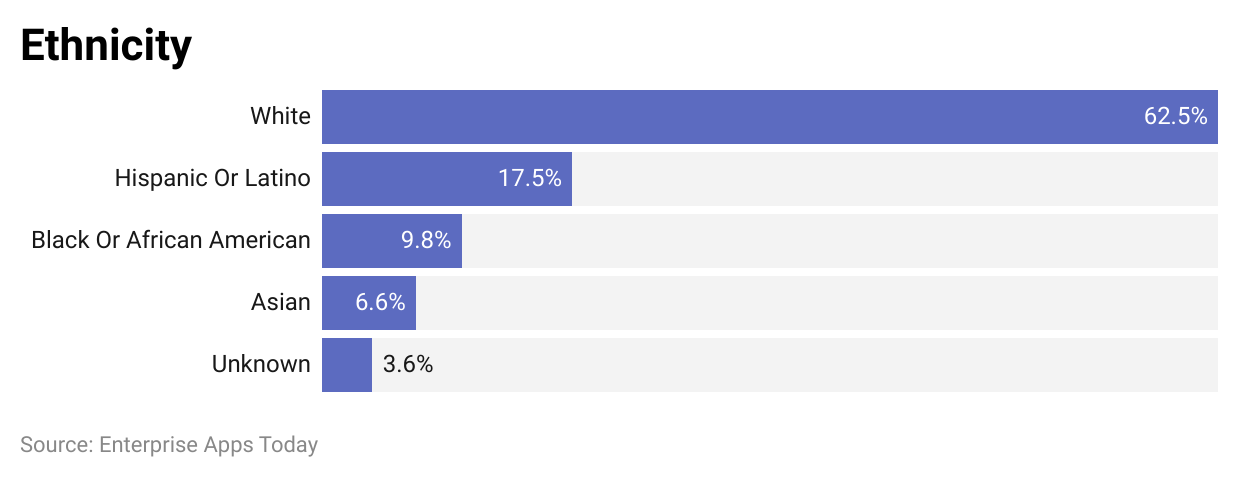
- White: The largest group of Dunkin' employees, making up 63% of the workforce.
- Hispanic or Latino: Representing 18% of employees, this group is a significant part of Dunkin's diverse team.
- Black or African American: Making up 10% of the staff, showcasing Dunkin's commitment to inclusivity.
- Average Salary: Employees at Dunkin' Donuts earn an average of $27,851 per year, reflecting the pay scale within the fast-food industry.
- Political Affiliation: A majority of Dunkin' employees tend to support the Democratic Party, indicating a possible trend in the political leanings of the workforce.
By Education Background
(Reference: zippia.com)
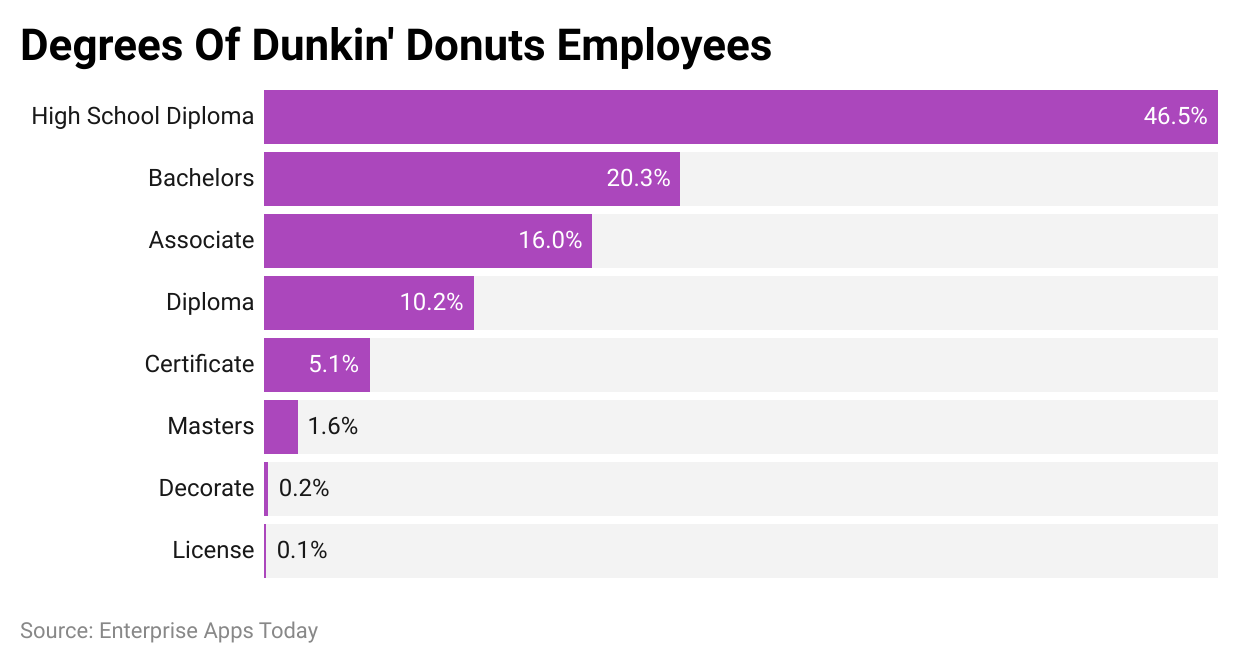
- High School Diploma: The largest segment of Dunkin's employees, accounting for 46.5%, hold a high school diploma. This reflects the accessibility of positions within the company for individuals with foundational education levels.
- Bachelor's Degree: Representing a significant portion of the workforce, 20.3% of Dunkin's employees have obtained a bachelor's degree, indicating roles that require more advanced skills and knowledge.
- Associate Degree: 16% of employees possess an associate degree, showcasing opportunities for those with mid-level post-secondary education.
- Diploma: A smaller segment of the workforce, 10.2%, have a diploma, suggesting specific vocational or technical training.
- Certificate: 5.1% of employees have earned a certificate, likely in fields directly relevant to their roles within Dunkin'.
- Master's Degree: The smallest group, at 1.6%, holds a master's degree, indicating specialized roles that require advanced academic credentials.
By Age
(Reference: zippia.com)
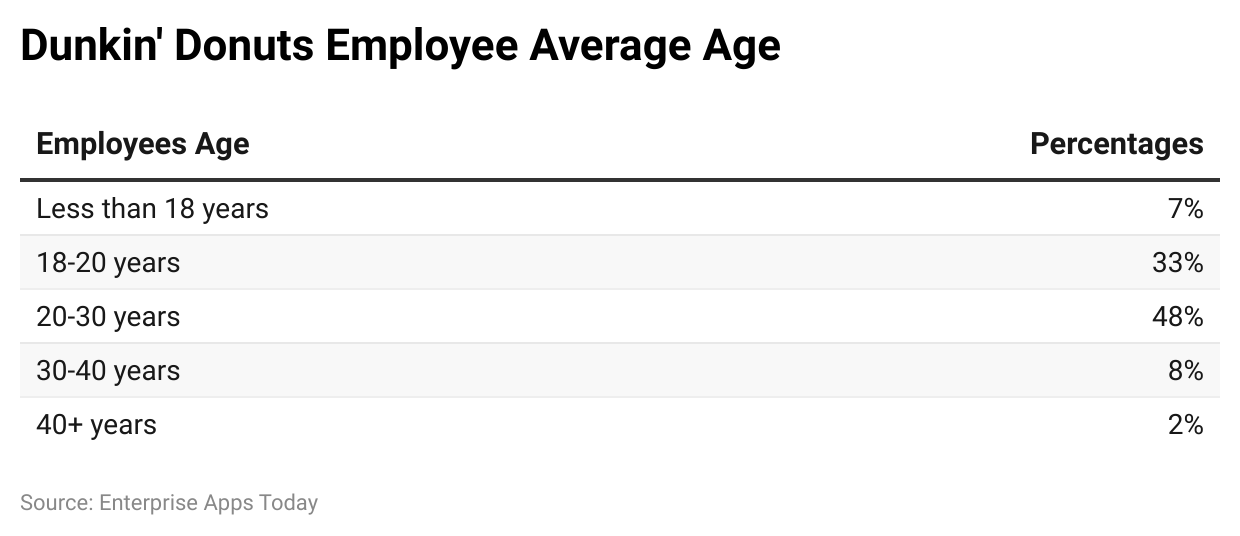
- Youthful Workforce: A significant portion of Dunkin' employees, nearly half (48%), falls within the 20 to 30 age range. This demographic represents the largest group, indicating a youthful and potentially energetic workforce.
- Early Career Individuals: The next substantial age group is those aged 18 to 20 years, constituting 33% of the workforce. This suggests that Dunkin' is a popular choice for first-time job seekers and students looking for part-time employment.
- Mid-Career Employees: Those between the ages of 30 to 40 years make up 8% of Dunkin's employees, highlighting a smaller but essential segment of the workforce that may bring more experience to their roles.
- Young Entrants: Employees below 18 years account for 7%, showcasing Dunkin's role as an entry point into the workforce for many high school students.
- Seasoned Professionals: A small fraction, just 2%, of the workforce is aged 40 and above. This indicates that while Dunkin' employs individuals from a broad age spectrum, there is a lesser representation of older employees.
By Length of Employment
(Reference: zippia.com)
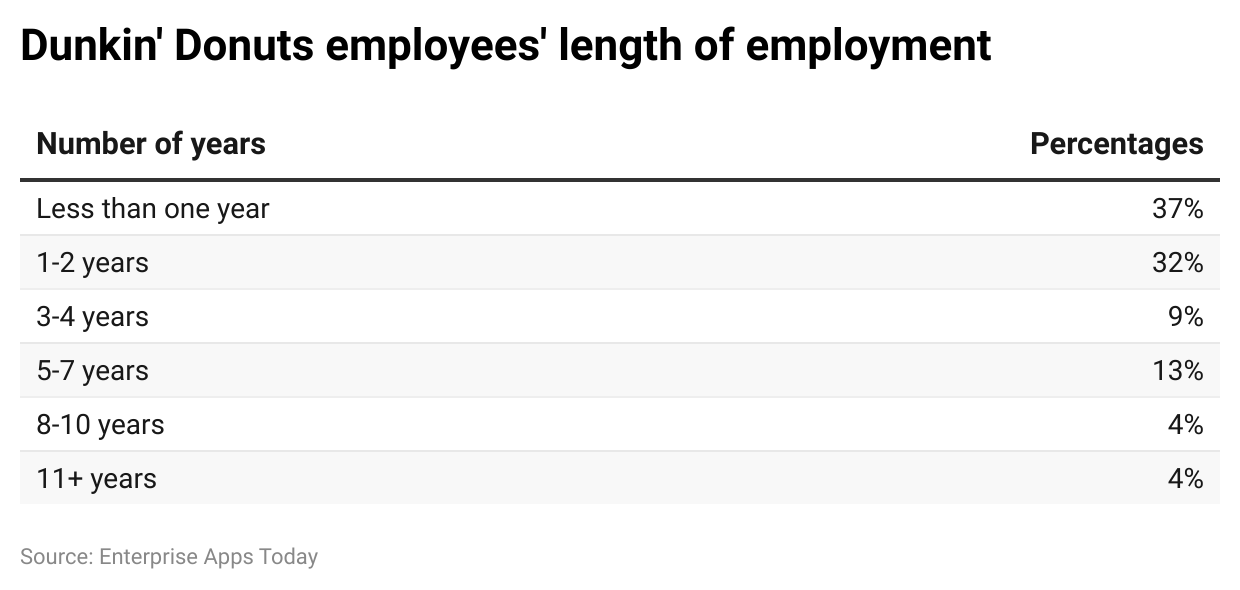
- Short-term Employment: A significant portion of Dunkin's workforce, about 37%, prefer a tenure of less than one year, indicating a high turnover rate for entry-level or short-term positions.
- Up to Two Years: A substantial 32% of employees choose to extend their tenure up to two years, suggesting a moderate level of commitment or satisfaction with the workplace environment for a considerable number of staff.
- Mid-term Tenure: Employees who decide to stay with Dunkin' for a duration of 3 to 4 years account for 9%, reflecting a smaller, yet significant, segment of the workforce that may find longer-term value in their roles or opportunities for advancement.
- Long-term Loyalty: Only 4% of the workforce opts to remain at Dunkin' for a period of 8 to 11 years, illustrating a relatively low proportion of employees who commit to the company for nearly a decade or more, possibly due to career progression, loyalty to the brand, or satisfaction with the job.
American Customer Satisfaction Index Score by Restaurant Brand
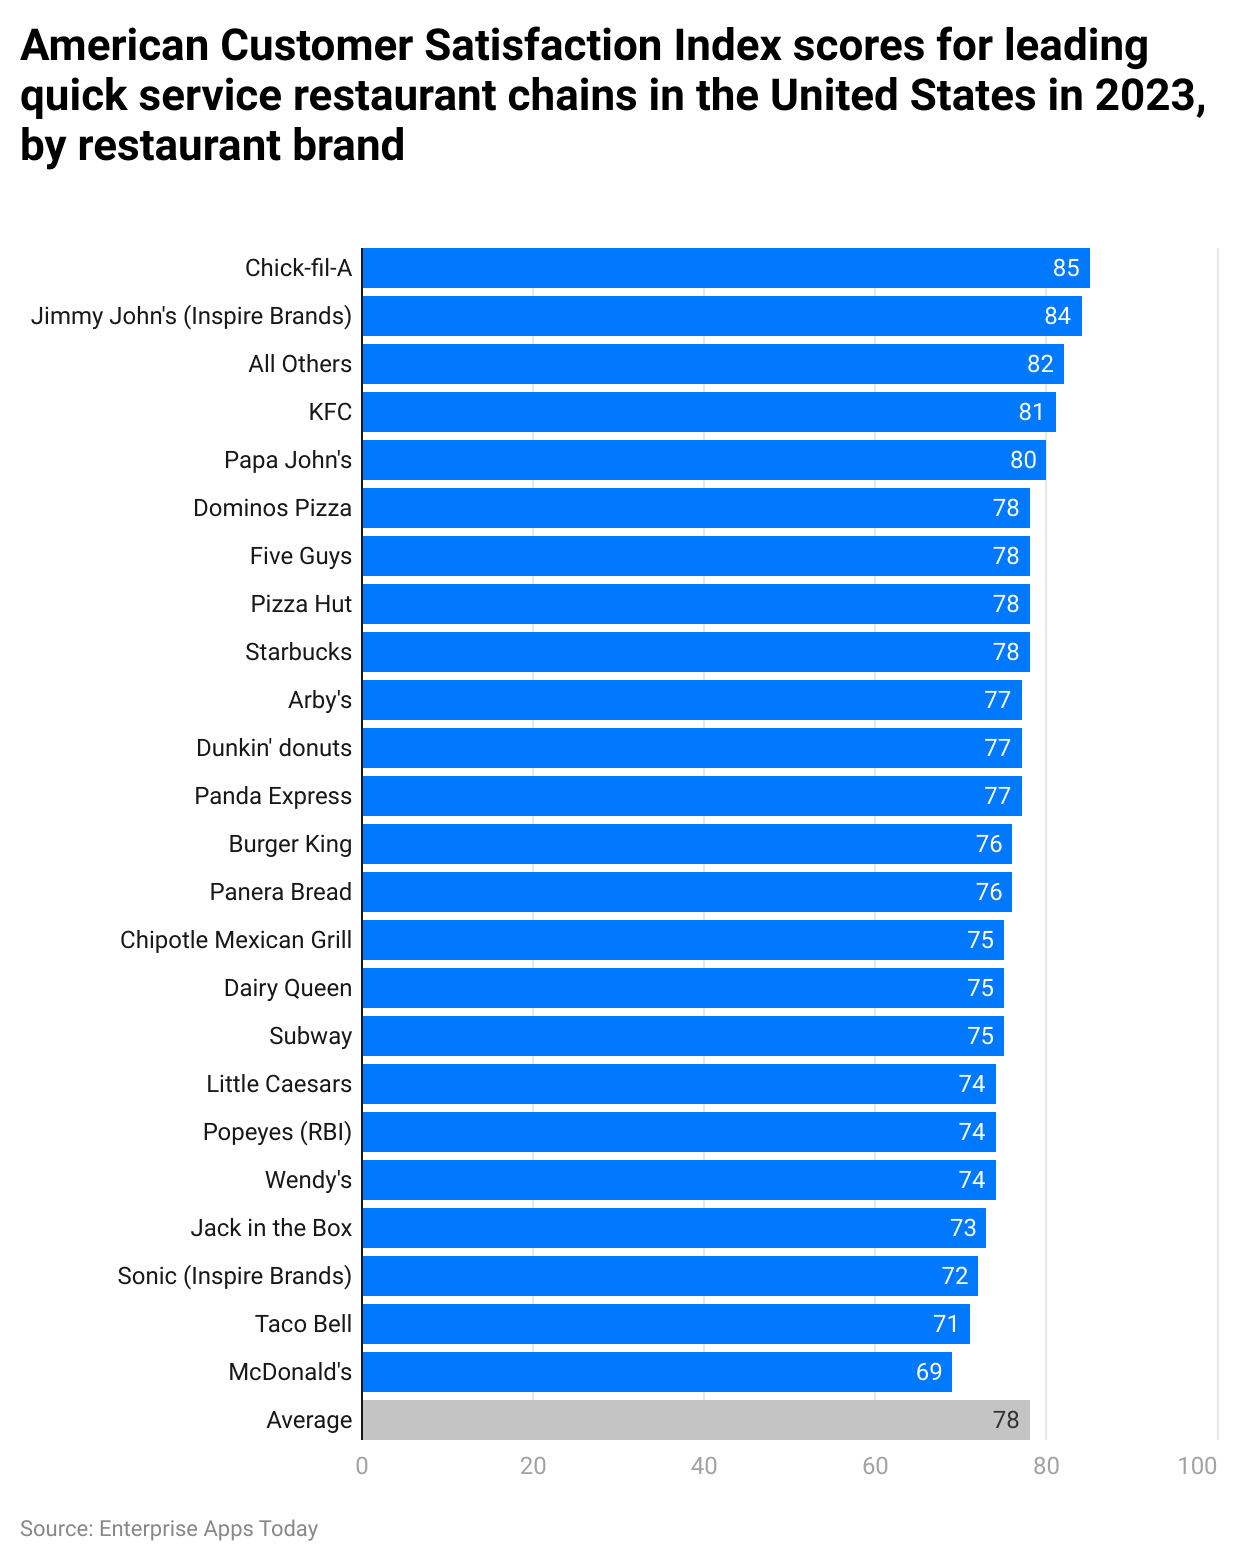
(Reference: statista.com)
In the 2023 American Customer Satisfaction Index (ACSI), Dunkin' scored 77, showing a 4% improvement from its previous score. This places Dunkin' just below the industry average for quick service restaurants (QSRs), which is 78. Chick-fil-A led the segment with the highest satisfaction score of 85, underscoring its position as the top brand in the USA within this category. These statistics reveal the competitive landscape of the QSR sector and highlight areas for potential improvement and customer satisfaction enhancement for Dunkin'.
By Order Confirmation Boards
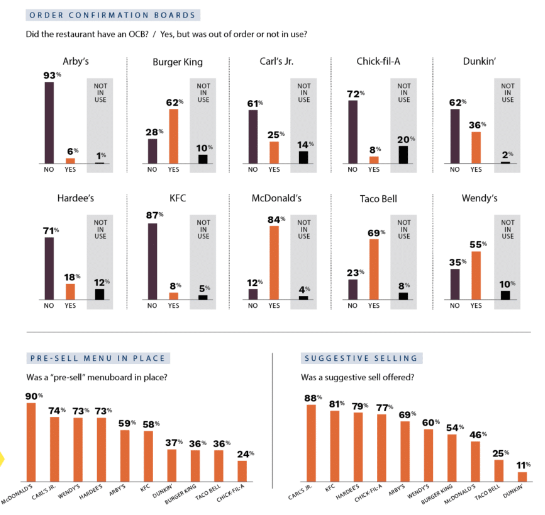
(Source: qsrmagazine.com)
Based on the insights gathered from the QSR Magazine's Drive-Thru Report and the 2021 study on Order Confirmation Boards, here are the key statistics and findings related to Dunkin' and its use of order confirmation boards (OCBs) in a digestible, list format:
- Usage of Order Confirmation Boards (OCBs) at Dunkin': Dunkin' has implemented OCBs in a portion of its locations, aiming to enhance order accuracy and customer satisfaction. The presence of OCBs is part of Dunkin's broader strategy to modernize and personalize the customer experience across all its outlets.
- Impact of Digital Menus and OCBs: The study indicates a customer preference for digital menus, with 39% of respondents appreciating them for their ease of reading. Dunkin' is responding to this trend by investing in digital menuboards and kiosks, alongside improvements to its mobile app, to sustain the drive-thru uptick observed during recent years.
- Customer Feedback on Order Accuracy: Order accuracy has emerged as a critical factor for customer satisfaction in the drive-thru experience. Dunkin' is focusing on enhancing order accuracy, with the implementation of digital order confirmation as a key measure. This strategy has proven effective, allowing stores to not only increase accuracy but also maintain service speed.
- Innovation in Service: Dunkin' is exploring the use of AI learning to further improve the drive-thru experience and alleviate employee workload. The Next-Generation design, introduced in 2018, showcases an open layout with various off-premises options, including traditional and online/third-party pickup drive-thru lanes. This design supports “On-the-Go Ordering” via the Dunkin' mobile app, enabling advanced order placement.
- Personalization and Modernization Efforts: Dunkin' aims to offer a more personalized and modern experience across all locations. The emphasis on order accuracy and the introduction of digital order status boards are steps towards this goal, helping to reduce drive-thru errors and delays.
- Industry Comparison: When compared to other chains, Dunkin' had one of the lower percentages of locations with OCBs, indicating room for expansion in this area to match or exceed industry standards.
By Online Business
By Website Traffic by Country
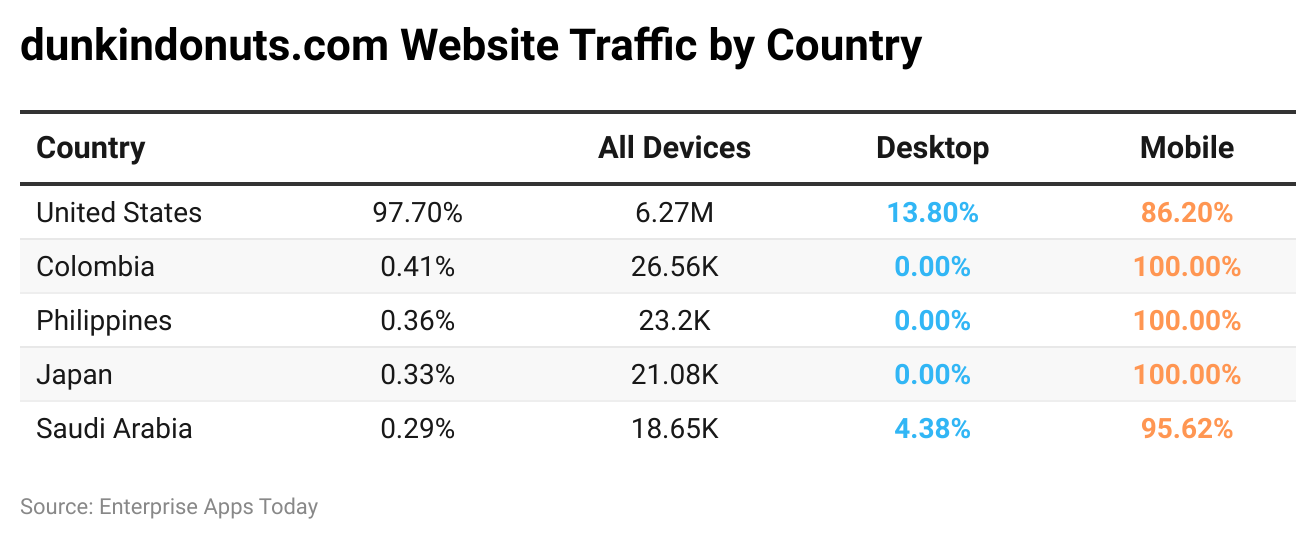
(Reference: semrush.com)
Dunkindonuts.com generated the highest traffic from the United States of America in the past 6 months of 2023. Overall traffic generated from these top 5 countries is from mobile devices. The total contribution of mobile devices is 86.12%, while desktop traffic is 13.88%.
By Calorie Count
| Sandwiches | Calorie (kcal) | Fat (g) | Carbs (g) | Protein (g) |
| Egg and Cheese on Croissant, 1 serving | 500 | 31 | 40 | 15 |
| Double Sausage Breakfast Sandwich, 1 serving | 900 | 54 | 70 | 33 |
| Egg and Cheese on Plain Bagel, 1 serving | 460 | 13 | 66 | 19 |
| Bacon Avocado Tomato Sandwich, 1 serving | 480 | 18 | 64 | 17 |
| Donuts | Calorie (kcal) | Fat (g) | Carbs (g) | Protein (g) |
| Apple Streusel Donut, 1 serving | 310 | 12 | 46 | 5 |
| Apple ‘n Spice Donut, 1 serving | 230 | 10 | 31 | 4 |
| #ALLCAPS Donut, 1 serving | 270 | 11 | 37 | 4 |
| Apple Crumb Donut, 1 serving | 290 | 11 | 44 | 5 |
| Apple Stick, 1 serving | 470 | 30 | 50 | 4 |
| Biscuits | Calorie (kcal) | Fat (g) | Carbs (g) | Protein (g) |
| Biscuit, 1 serving | 270 | 14 | 32 | 5 |
| Sausage Biscuit, 1 serving | 490 | 34 | 32 | 13 |
| Chicken Biscuit, 1 serving | 460 | 22 | 46 | 21 |
| Stuffed Biscuit Bites, 1 serving | 260 | 13 | 25 | 10 |
| Croissants | Calorie (kcal) | Fat (g) | Carbs (g) | Protein (g) |
| Plain Croissant, 1 serving | 340 | 19 | 37 | 6 |
| Chicken, Bacon and Cheese Croissant Stuffer, 1 serving | 330 | 18 | 29 | 14 |
| Bacon, Egg and Cheese on Croissant, 1 serving | 560 | 36 | 41 | 18 |
| Chocolate Croissant, 1 serving | 290 | 16 | 33 |
6
|
| Bagels | Calorie (kcal) | Fat (g) | Carbs (g) | Protein (g) |
| Plain Bagel, 1 serving | 300 | 1 | 54 | 11 |
| Everything Bagel Bites, 1 serving | 260 | 12 | 34 | 8 |
| Everything Bagel, 1 serving | 340 | 3 | 67 | 12 |
| Cinnamon Raisin Bagel, 1 serving | 320 | 1 | 67 | 11 |
| Multigrain Bagel, 1 serving | 380 | 8 | 63 | 15 |
| Muffins | Calorie (kcal) | Fat (g) | Carbs (g) | Protein (g) |
| Blueberry Muffin, 1 serving | 460 | 15 | 77 | 6 |
| Chocolate Chip muffin, 1 serving | 510 | 20 | 74 | 8 |
| Coffee Cake Muffin, 1 serving | 590 | 24 | 88 | 7 |
| Carrot Cake Muffin, 1 serving | 550 | 21 | 85 | 7 |
| Bacon, Egg, and Cheese on English Muffin, 1 serving | 400 | 19 | 39 | 18 |
(Source: fatsecret.com)
Conclusion
Dunkin', initially known as Open Kettle, has transformed into a global leader in the quick-service restaurant sector. With 12,700 stores across 40 countries, Dunkin' emphasizes coffee, accounting for 60% of its revenue. Annually, it sells 2 billion cups of coffee, or 60 cups per second, highlighting its popularity. Despite the fierce competition, Dunkin' ties with Starbucks as the brand of the year in the coffee shop category. Its revenue and product sales, including 2.9 billion donuts and significant earnings from K-cups and ground coffee, underscore Dunkin's impressive growth and its solid position within the top ranks of the industry.
Sources

Barry is a lover of everything technology. Figuring out how the software works and creating content to shed more light on the value it offers users is his favorite pastime. When not evaluating apps or programs, he's busy trying out new healthy recipes, doing yoga, meditating, or taking nature walks with his little one.