
Social Security Statistics 2024 – By Revenue, Demographics, Benefits, States, Covered Population

Page Contents
Introduction
Social Security Statistics: Delving into Social Security statistics provides crucial insights into the financial landscape and retirement preparedness of individuals. With over 65 million beneficiaries receiving Social Security benefits in the United States, this program plays a pivotal role in supporting retired workers, their families, and individuals with disabilities. As of the latest data available, the Social Security Administration distributed over USD 1 trillion in benefits in the fiscal year, demonstrating its immense financial impact and significance to millions of Americans. Moreover, with an aging population, the importance of Social Security is expected to grow further, with projections indicating that over 25% of the U.S. population will be aged 65 or older by 2060. These statistics underscore the need for continuous analysis and assessment of Social Security programs to ensure their sustainability and effectiveness in providing financial security to retirees and beneficiaries.
Editor’s Choice
- Approximately 30% of income for the elderly comes from Social Security benefits.
- In 2022, an estimated 66 million Americans received Social Security benefits each month.
- Social Security benefits reach 9 out of 10 citizens in the United States annually.
- The average monthly disability benefit is $1,280.
- Annually, about 6 million Americans receive Social Security benefits, totaling USD 1 trillion.
- The reserves of the Social Security Trust Fund amount to USD 2.85 trillion.
- West Virginia has the highest percentage of residents receiving benefits, at 26.9%.
- Social Security accounts for 8% of the United States' GDP.
- Approximately 25.2% of adults in the US receive monthly Social Security payments.
- The maximum monthly benefit as of 2022 is USD 4,194.
- The average monthly benefit is USD 1,550.48 as of October 2022.
- Social Security's annual cost is USD 1.2 trillion.
- 46.7 million American retirees are receiving Social Security benefits.
- Social Security constitutes 4.8% of the total US GDP.
- Nearly 67 million Americans receive Social Security benefits monthly.
- Social Security benefits keep 15.2 million elderly Americans out of poverty.
- Workers retiring after 2034 will receive only 77% of full benefits.
- California had the highest number of beneficiaries in 2020, with 6.15 million.
- After 2033, retirees may only receive 76% of scheduled benefits.
You May Also Like To Read
- Gun Violence Statistics
- Domestic Violence Statistics
- Sexual Assault Statistics
- Human Trafficking Statistics
- Crime Statistics
- FBI Crime Statistics
- Referral Marketing Statistics
- Prison Statistics
- GDPR Statistics
- Piracy Statistics
- Notable Ransomware Statistics
- DDoS Statistics
- Divorce Statistics
What is Social Security?
Social security is the most common program used in the United States of America. The program supports needy persons to keep them away from touching the poverty line. The Social Security Act was coined in the year 1935 and further amended acts supported various programs.
Programs Offered Under Social Security
Under the act of Social Security following are the largest used programs:
- Supplemental Security Income (SSI)
- Grants to States for medical assistance programs for low-income citizens, Medicaid
- State Children’s health insurance program for low-income citizens (SCHIP)
- Temporary Assistance for Needy Families (TANF)
- Federal Old Age, Survivors, and disability insurance (OASDI)
- Health Insurance for the aged and disabled, Medicare
General Social Security Statistics
- In the year 2022, around 66 million Americans received benefits of social security each month.
- 8% of the United States of America’s GDP belongs to the share of social security.
- Social security is the primary source of income for many elderly people in the United States of America.
- Social security statistics estimate that around 1 out of 4 in today’s generation of 20-year-olds will go disabled before reaching the age of 67.
- Another estimate states that more than 1 out of 8 of today’s 20-year-olds will be deceased before reaching 67 years of age.
- Social security statistics say that 30% of the income belongs to income from social security benefits of income for the elderly.
- As of 2022, on average 6 million, Americans received social security benefits every month resulting in the amount of $1 trillion of benefits every year.
- There were around 65.67 million people in the United States of America who received benefits of social security in the year August 2022.
- Every year, 9 out of 10 citizens of the United States of America benefit from social security programs.
- As per the Social Security statistics, around 15.2 million elderly people in the United States of America are kept away from poverty.
- $2.85 trillion has been received in the reserves of the Social Security Trust Fund.
- West Virginia ranks highest in the receiver of the benefit resulting in 26.9%.
- As an American citizen, a person must earn 40 lifetime work credits to be eligible to earn the benefits of social security.
- If a person waits until he becomes 70 years of age, then he/she is eligible to receive 8% more amount every year after the full retirement age.
- As of 2022, the highest ever amount a person can receive is $4,194 every month.
- Workers in the United States of America who will retire after 2034 will receive around 77% of the full Social Security benefit.
- Around 25.2% of adults in the United States of America receive monthly payments from the Social Security program.
- According to Social Security statistics, 6.2% of Social Security receive funds from compulsory payroll tax.
- The average disability benefit per month is $1,280.
- As of 2021, there were around 10.26 million retired female workers aged between 62 years to 69 years for social security beneficiaries.
- In the year 2021, around 16.67 million retired women aged between 70 years to 84 years received social security benefits.
By Uncovered Population
- 32% of the employees are not covered under private pension coverage.
- 65% of private sector employees have not applied for long-term disability insurance.
By Revenue
 (Reference: SSA.gov)
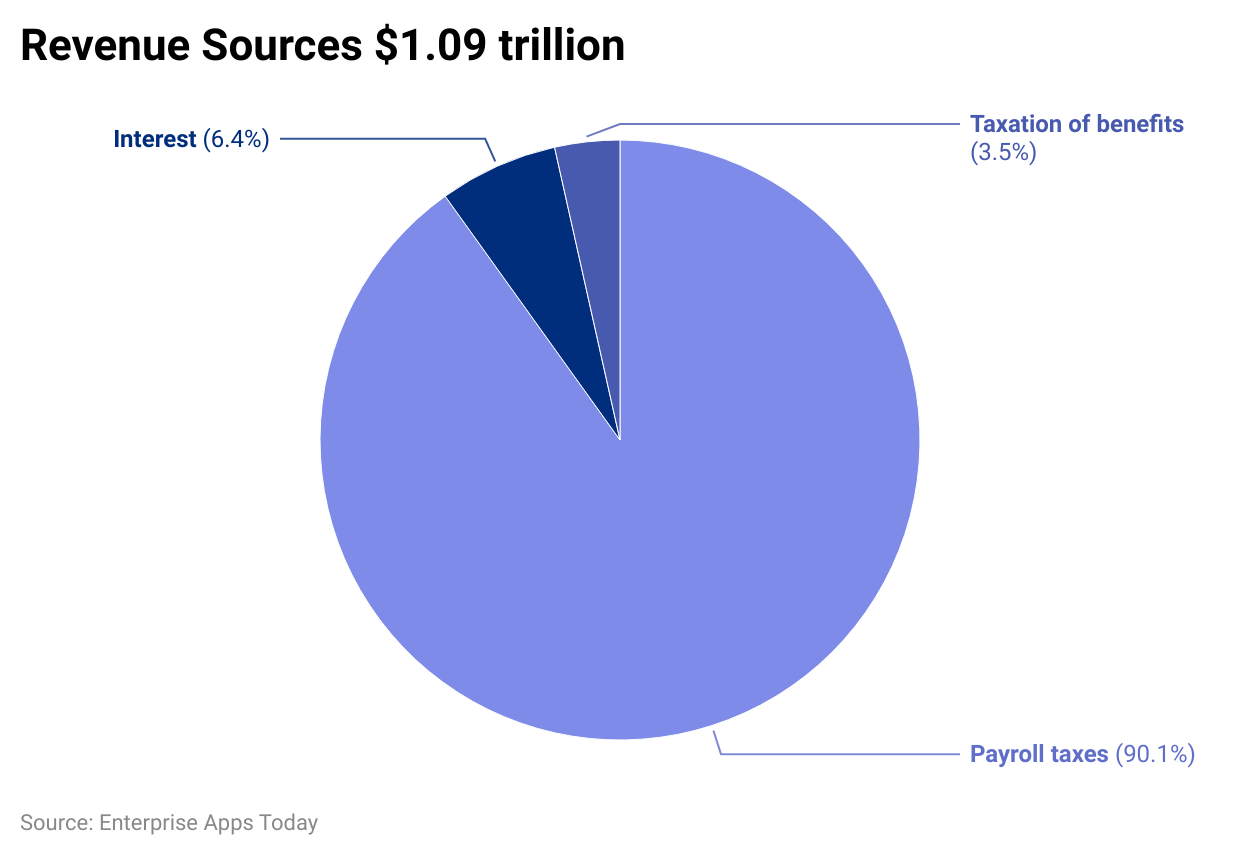
- According to the social security statistics of 2021, the overall revenue received from different sources for the program was around $1.09 trillion.
- Out of these 90.1% was generated from payroll taxes.
- 4% was generated from interest while 3.5% of the overall revenue belongs to the taxation of benefits.
By Expenditure Types
 (Reference: SSA.gov)
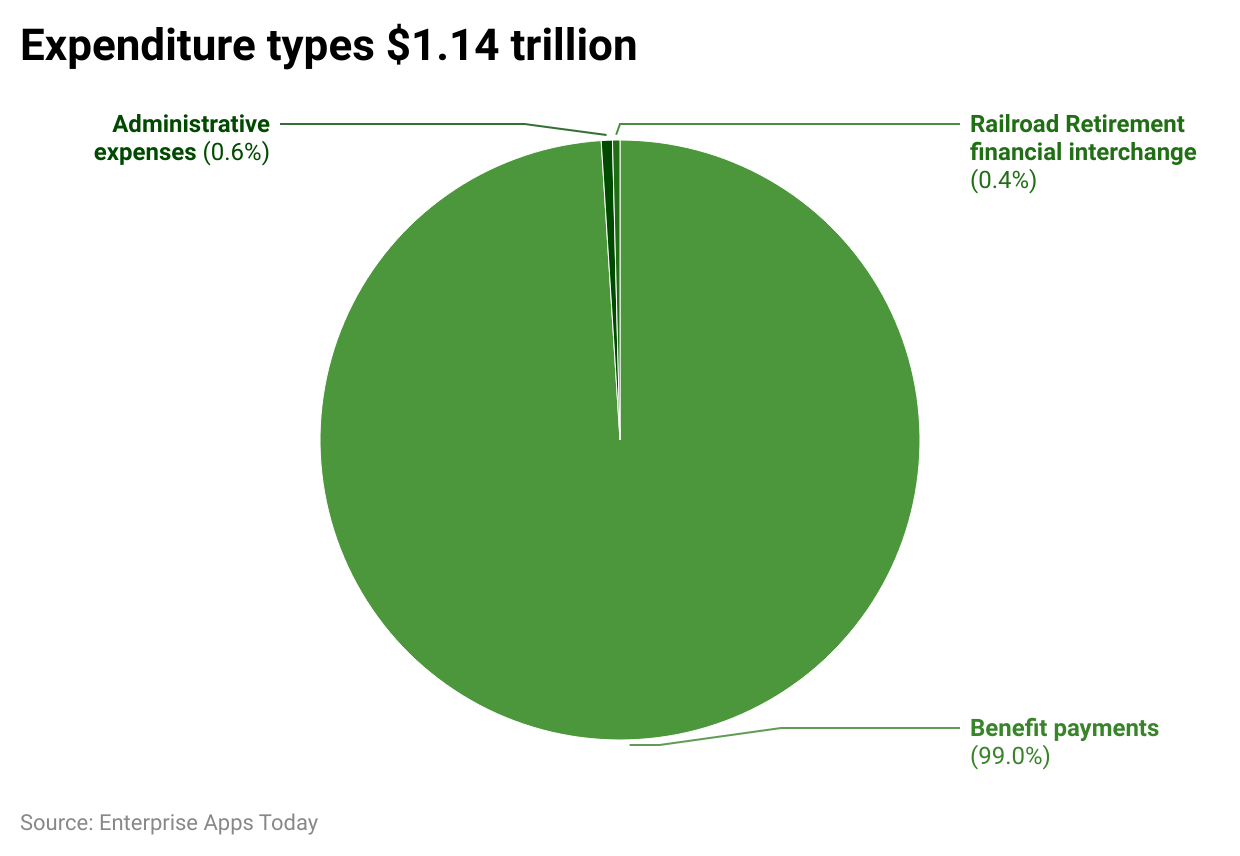
- On the other hand, the social security statistics of 2021 explain the total expenditure of $1.14 trillion.
- The highest part of expenses goes to benefits payments by 99%.
- While only 06% and 0.4% belong to administrative expenses and railroad retirement financial interchange expenses respectively.
By Covered Population
- In the year 2022, it was estimated that 2.8 were covered workers for every social security beneficiary.
 (Reference: Statista)
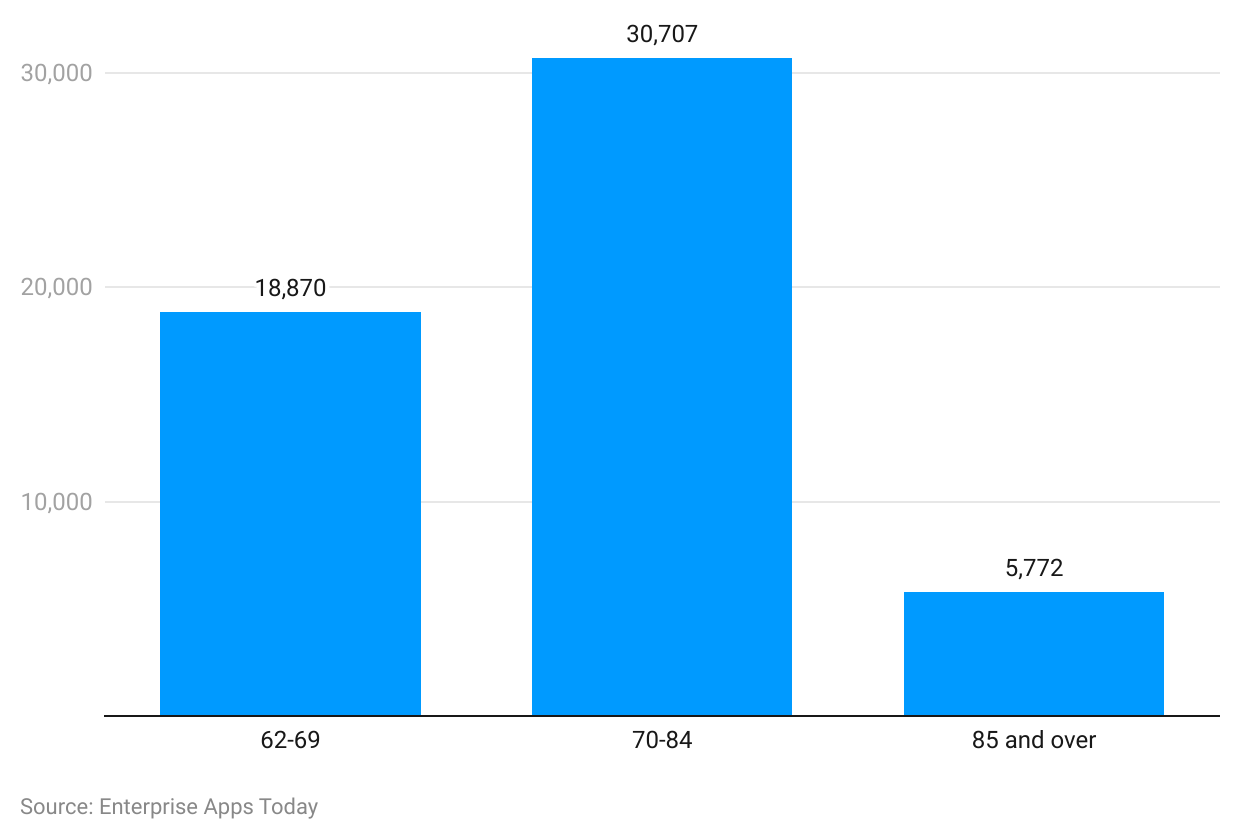
- The highest number of social security benefits receivers as of 2021 in the United States of America were from the age group of 70 years to 84 years resulting in 30,707.
- 18,870 benefit receivers belong to the age group of 62 years to 69 years.
- While the lowest of all was given for people 85 years and above resulting in 5,772.
By Demographics
- Considering the social security statistics of the elderly population, 12% of men and 15% of women depend on the scheme for 90% or more of their income.
- In similar demographics, 37% of the men and 42% of the women receive 50% or more income from the Social Security scheme.
- 15% of women depend on social security for more than 90% of their income. Similarly, 45% of single retirees depend on social security for more than 90% of their income.
- On the other hand, only 21% of married couples depend on social security in a similar income bracket.
 (Reference: Center on Budget and Policy Priorities)
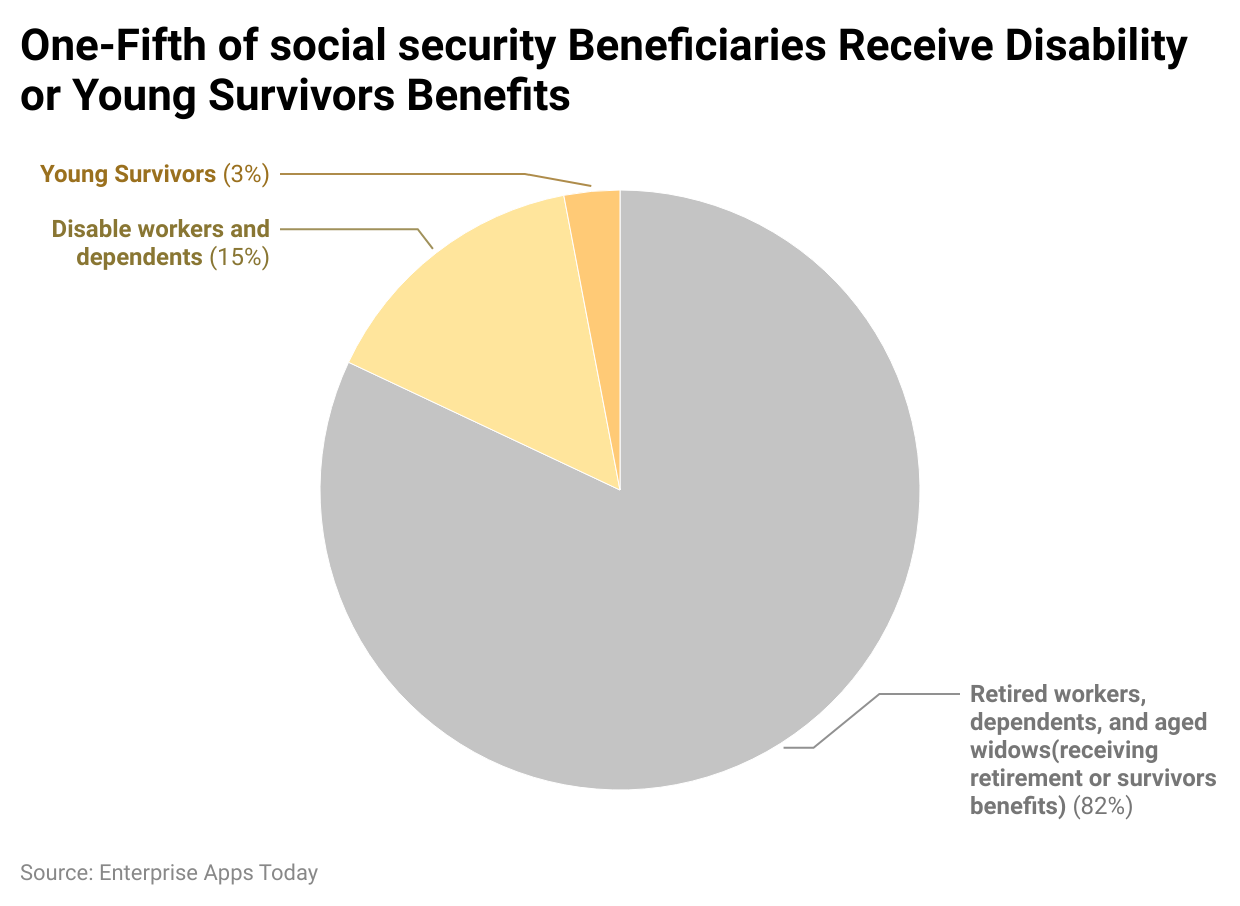
- As of June 2021, on average 1 out of 5th beneficiaries get disability or young survivors benefits.
- 82% of the benefits are paid to retired workers and their dependents and aged widows who are receiving retirement or survivor benefits.
- 3% of the overall beneficiaries are young survivors and 15% of the benefits are paid out to disabled workers and their dependents.
 (Reference: SSA.gov)
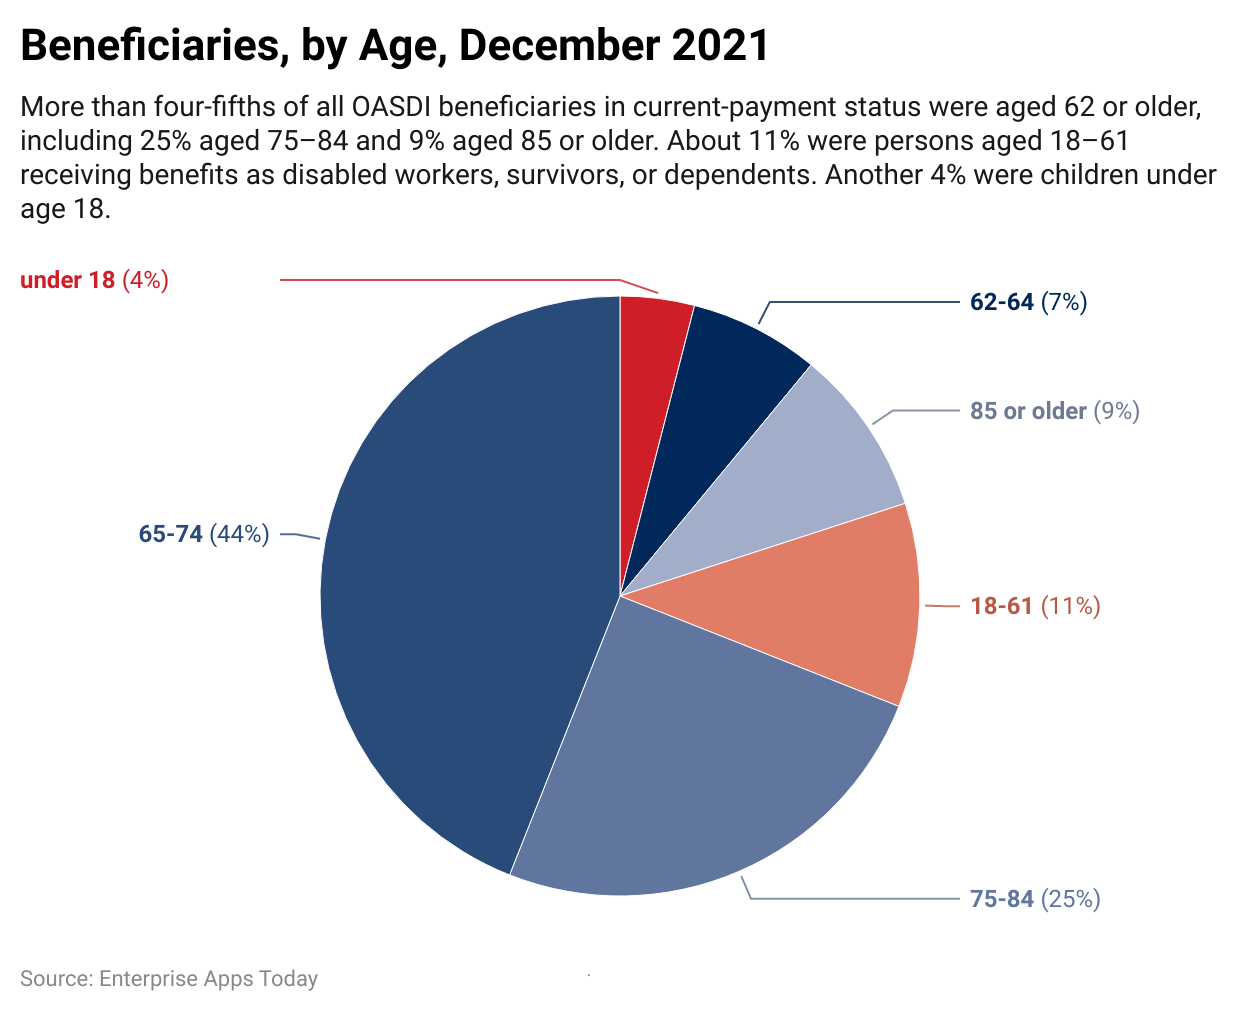
- The highest benefit of the OASDI program in the United States of America was given to people from the age of 65 years to 74 years resulting in 44%.
- Similarly, 25% of the OASDI beneficiaries as of 2021, belong to the age group of 75 years to 84 years.
- Furthermore, there were 11% of the people from the age group of 18 years to 61 years, and 9% and 4% belonged to 85 years and above and below 18 years respectively.
 (Reference: SSA.gov)
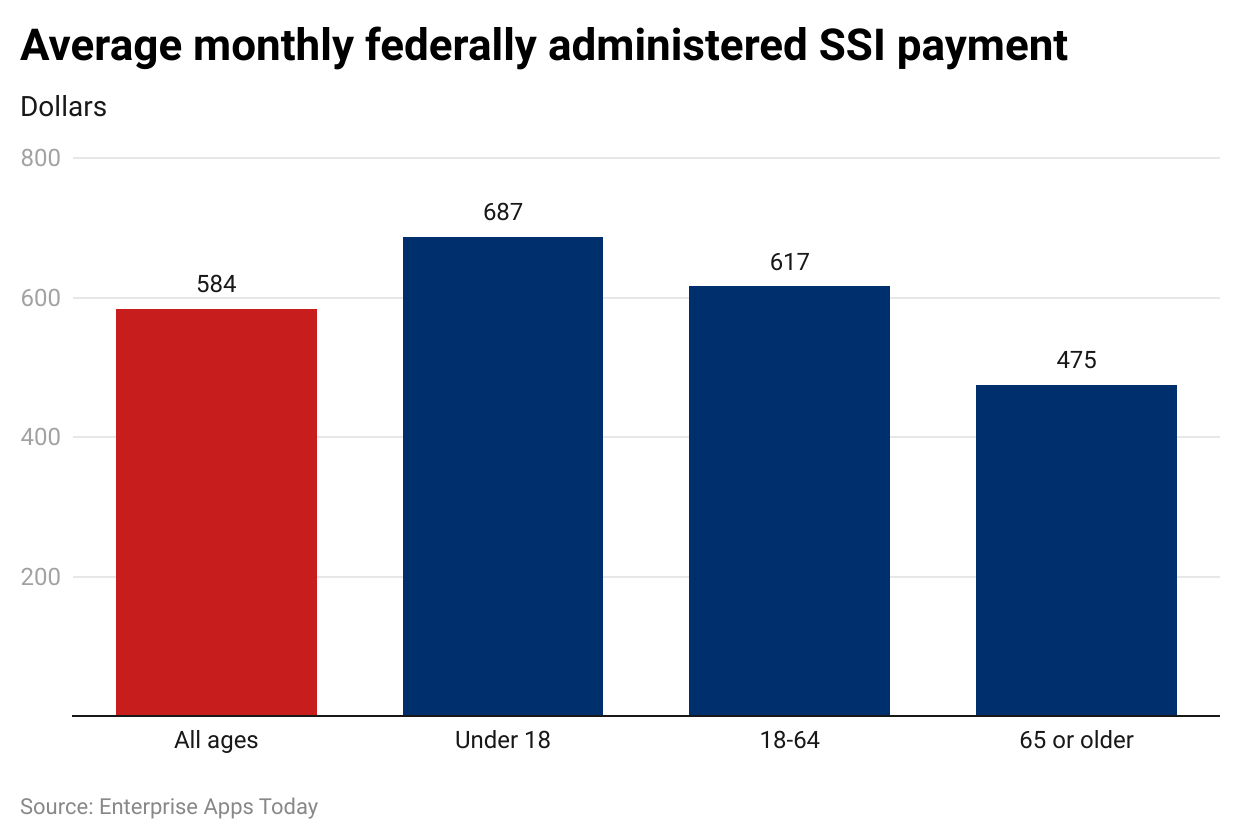
- Another program of social security – SSI pays an average amount of $584 every month to people of all ages.
- To be more specific, in the United States of America, residents who were under 18 received $687 on average every month, as of 2021.
- People from the age of 18 years to 64 years received around $617 while people 65 years and above received around $475 on an average monthly basis.
By ethnicity
| Characteristic | All grade levels |
|---|---|
| Women | 64.6 |
| Minorities | 55.0 |
| Black | 30.4 |
| Hispanic | 15.7 |
| Asian/Pacific Islander | 7.5 |
| American Indian/Alaska Native | 1.3 |
| Employees with targeted disabilities | 3.5 |
| Total * | 59,518 |
(Reference: SSA.gov)
- As of 2021, social security statistics say that there were around 59,518 people eligible as beneficiaries.
- Out of these, 64.6% were women, which belonged to 55% of the minority population.
- 4% of the population in the list of beneficiaries was black by ethnic background.
- 7% were from the Hispanic ethnic background while 7.5% were Asian/Pacific Islanders.
- Similarly,1.3% of beneficiaries of social security in the year 2021, were American Indian / Alaska natives by ethnic background.
By Paid Accounts
- In the year 2021, 76.1% of total benefits to retired workers along with their dependents were paid.
- In a similar duration, Social Security statistics say that around 12.4% of the total benefits were paid to disabled workers and their dependents in the United States of America.
- Around 11.6% of the total benefits were paid to survivors of deceased workers as of 2021 in the United States of America.
By Benefits
 (Reference: SSA.gov)
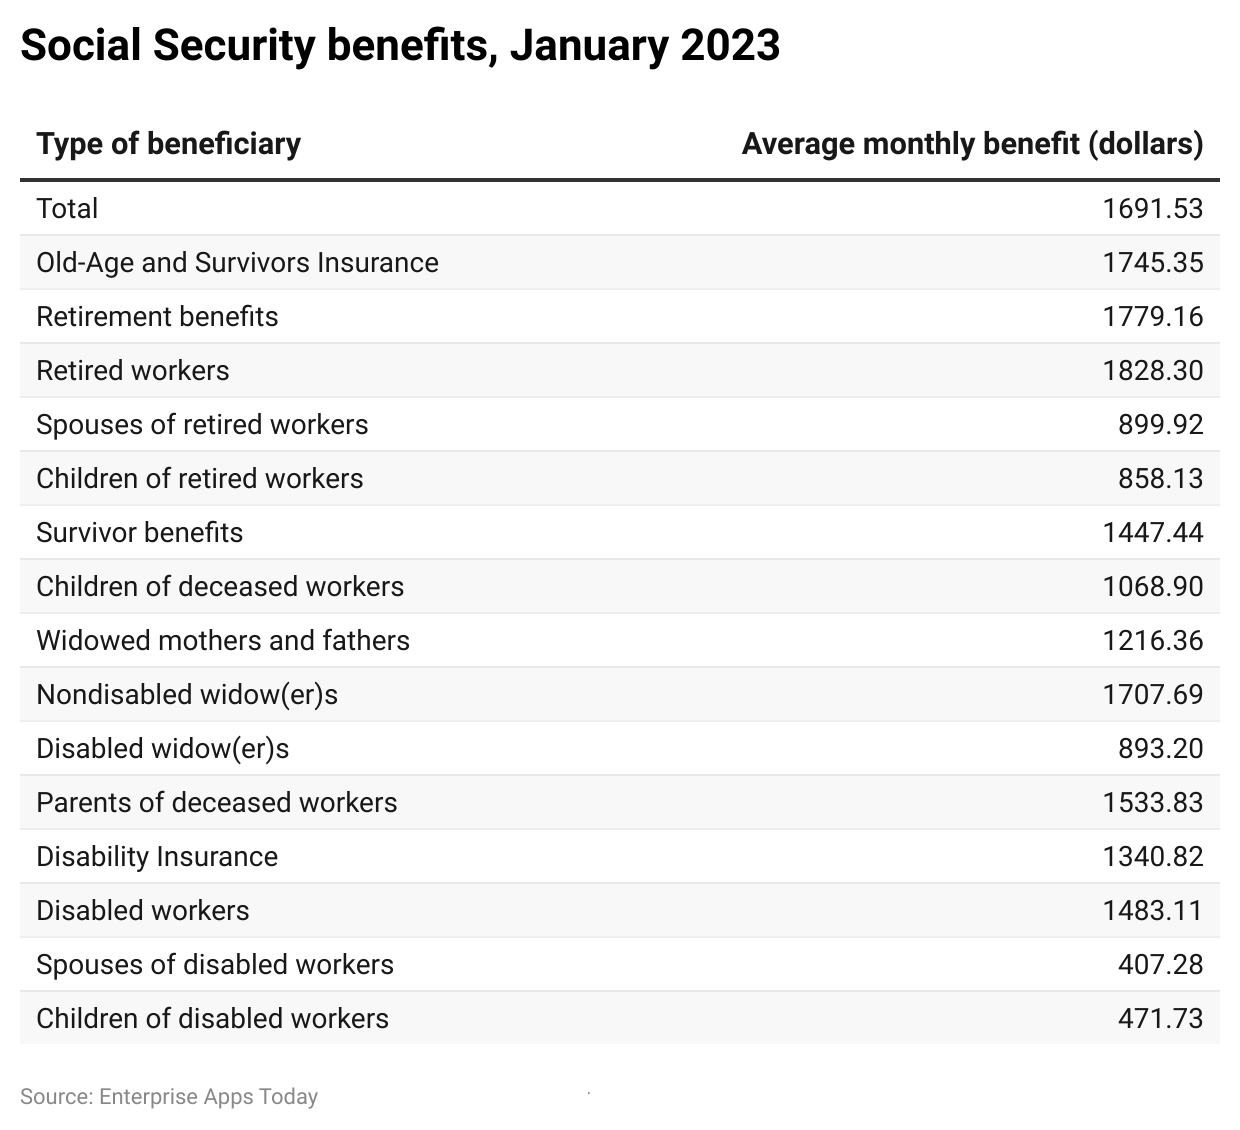
- As of 2022, the social security statistics say that, in November 2022, the total average monthly benefit was $1,551.66.
- While in a similar category, the AMB received $1,601.13.
- In the retirement benefits retired workers received 1,677.52 and the spouses of retired workers received around $830.29. While Children of retired workers received around $787.61 as a monthly average benefit.
- In terms of survivor benefits, children of deceased workers received $981.33 on average monthly benefits. Widowed mothers and fathers were eligible for $1,135.79. Disabled widows or widowers received $820.87, and parents of the deceased workers received around 1,408.87
- Considering the disability insurance, disabled workers received 1,364.28 as the average monthly benefit while spouses and children were eligible for $375.97 and 432.23 respectively.
 (Reference: ZIPPIA)
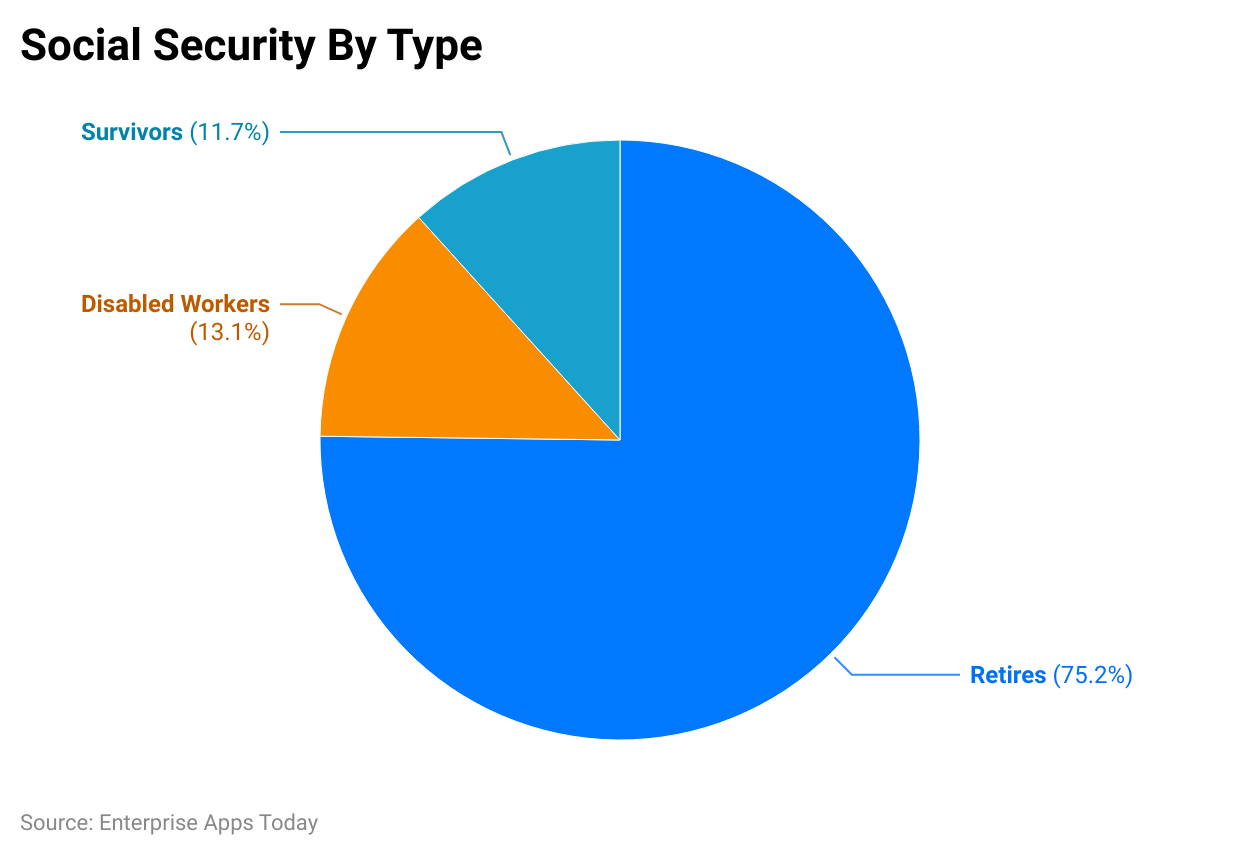
- As of 2021, there were 75.2% of retirees in the list of beneficiaries of social security are the largest of all.
- While 13.1% belonged to disabled workers and 11.7% were from survivors.
Social Security Facts
- The first ever social security benefit cheque was paid out in the year 1940 amounting to $22.54 which counts to $477.86 as of today.
- More than 1 million workers registered their names for Social Security numbers after just 8 days of the program’s launch.
- As of today, the Social Security program is the largest government-run program in the United States of America.
By states
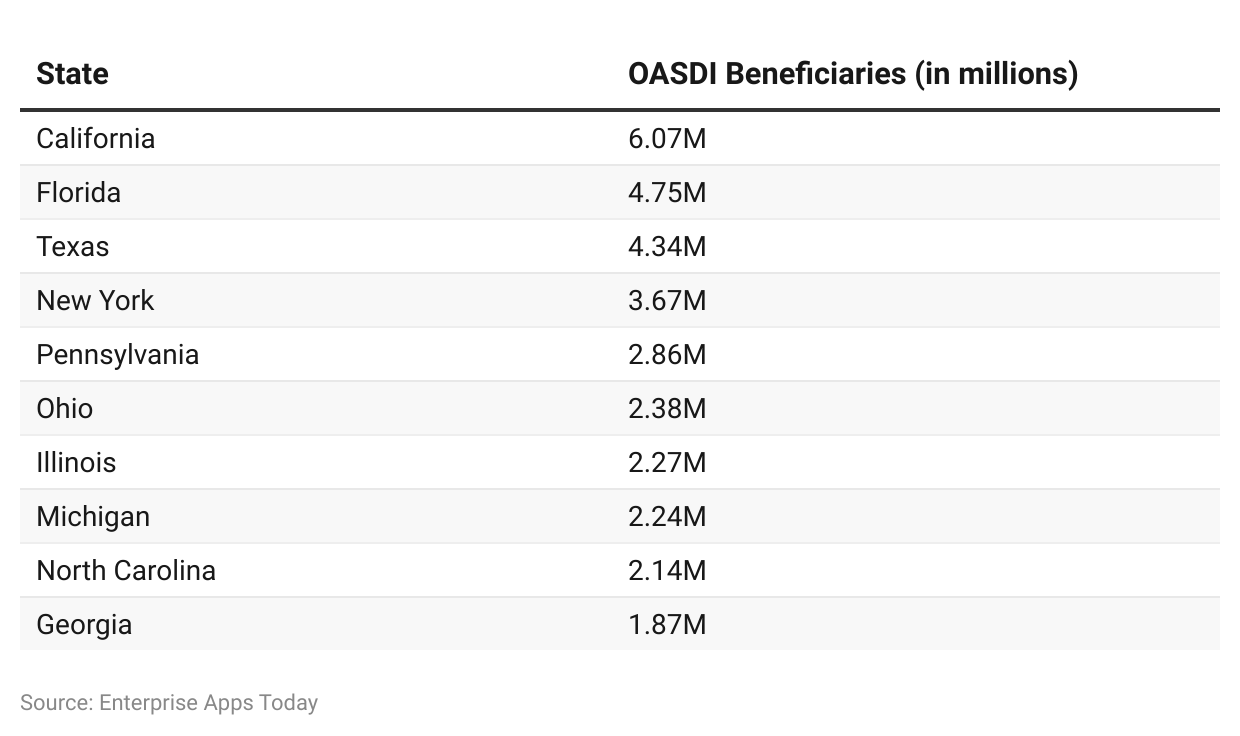
(Reference: Zippia)
- As of 2021, in the United States of America, California ranked top for having the highest number of OASDI beneficiaries resulting in 6.07 million.
- Florida recorded 4.75 million while Texas had 4.34 million.
- Other states with the overall highest number of OASDI beneficiaries are New York (3.67 million), Pennsylvania (2.86 million), Ohio (2.38 million), Illinois (2.27 million), Michigan (2.24 million), North Carolina (2.14 million) and Georgia (1.87 million).
Social Security Trends
- Increasing Beneficiaries: The number of Social Security beneficiaries is steadily rising due to aging populations and increased life expectancy.
- Financial Sustainability Concerns: Concerns about the long-term financial sustainability of Social Security continue to grow, prompting discussions on potential reforms and adjustments.
- Changing Retirement Patterns: Trends show that more individuals are delaying retirement and opting to work longer, impacting the timing and duration of Social Security benefit claims.
- Shifting Demographics: Demographic shifts, including aging baby boomers and declining birth rates, are influencing the ratio of workers to retirees, posing challenges to the program's financing.
- Economic Impact: Social Security plays a crucial role in supporting retirees and stimulating economic activity, with changes in benefit levels and eligibility criteria affecting consumer spending and savings patterns.
- Policy Debates: Ongoing policy debates and political discussions focus on addressing Social Security's financial challenges, balancing the needs of current and future beneficiaries, and ensuring the program's sustainability for future generations.
Recent Developments in Social Security
- Cost-of-Living Adjustment (COLA): Recent adjustments to Social Security benefits have been made to account for increases in the cost of living, reflecting changes in inflation rates to ensure beneficiaries' purchasing power is maintained.
- Legislative Proposals: There have been legislative proposals aimed at enhancing Social Security benefits, addressing solvency concerns, and modernizing the program to meet the evolving needs of retirees and workers.
- Technological Innovations: Advances in technology have led to improvements in Social Security administration processes, such as online account management, digital communication channels, and streamlined application procedures.
- COVID-19 Response: The COVID-19 pandemic has prompted temporary measures and policy adjustments to support Social Security recipients, including economic stimulus payments, expanded eligibility criteria, and remote service delivery options.
- Solvency Projections: Ongoing analyses and projections regarding the solvency of the Social Security program have been conducted, informing policymakers and stakeholders about future funding challenges and potential solutions.
Conclusion
In conclusion, the data on Social Security statistics provides valuable insights into the scope and impact of the program on retirees and beneficiaries. With approximately 67 million Americans receiving benefits each month and the average monthly benefit amounting to USD 1,550.48, Social Security plays a crucial role in ensuring financial stability for older adults.
The program's annual cost of USD 1.2 trillion underscores its significant contribution to the economy, representing 4.8% of the U.S. total GDP. However, challenges such as funding sustainability and demographic shifts necessitate ongoing analysis and potential reforms to maintain the program's effectiveness.
Despite concerns about future solvency, Social Security remains a critical lifeline for millions of elderly Americans, keeping 15.2 million individuals out of poverty. As market research analysts, it is essential to monitor legislative developments, technological innovations, and demographic trends that may impact Social Security policies and beneficiaries' financial well-being in the years ahead.
Sources
FAQ.
Social security pays the amount on the percentage of the pre-retirement income of the lifetime earnings. This can help in keeping people away from the poverty line.
As of 2023, if you retire at 70 will are eligible to receive $4,555 monthly. And if you retire at 62 as of 2023, the amount will be $2,572. Furthermore, if you retire at full retirement age in 2023, you will receive the maximum benefit of $3,627.
Social security benefits are for citizens of the United States of America, permanent residents, and noncitizens who work in the USA.
As a resident of the United States of America, once you turn 62 you are eligible for the benefits offered by the social security program.

Barry is a lover of everything technology. Figuring out how the software works and creating content to shed more light on the value it offers users is his favorite pastime. When not evaluating apps or programs, he's busy trying out new healthy recipes, doing yoga, meditating, or taking nature walks with his little one.